- New to JMP? Join us Sept. 23-24 for the Early User Edition of Discovery Summit, tailor-made for new users. Register now for free!
- Your voice matters! Tell us how you prefer to receive JMP updates, so we can tailor our communication to your needs. Take short survey.
- See how to access JMP Marketplace - and - find, create & share add-ins to extend your JMP. Watch video.
- Subscribe to RSS Feed
- Mark Topic as New
- Mark Topic as Read
- Float this Topic for Current User
- Bookmark
- Subscribe
- Mute
- Printer Friendly Page
Discussions
Solve problems, and share tips and tricks with other JMP users.- JMP User Community
- :
- Discussions
- :
- Re: Creating Formula Columns in a For Loop

- Mark as New
- Bookmark
- Subscribe
- Mute
- Subscribe to RSS Feed
- Get Direct Link
- Report Inappropriate Content
Creating Formula Columns in a For Loop
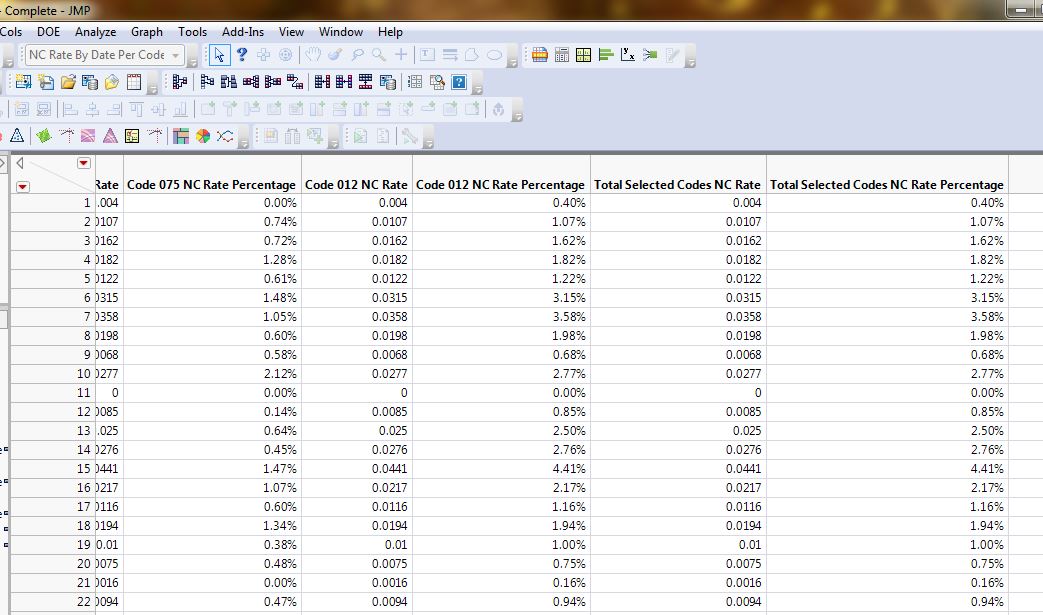
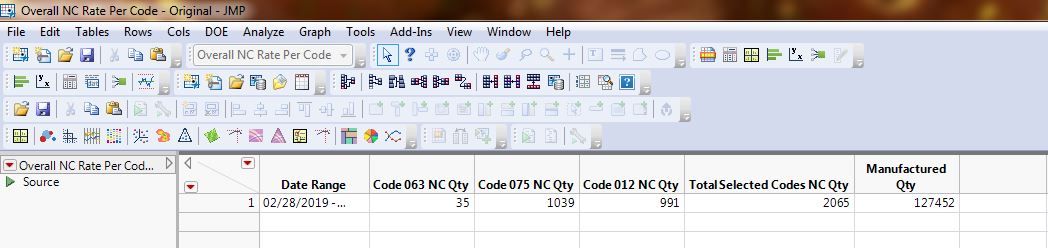
I have a script that calculates nonconformance rates for nonconformance codes and also creates control charts for each code over a user entered date range. The user can enter up to five individual codes and there are over 50 codes to pick from. There is a table created that has the total nonconforming quantity per code per date, the sum of the nonconforming quantities of all entered codes and the total quantity manufactured per day (NC Rate By Date Per Code - Original). Then I add to the table by iterating through a loop to add a column to calculate the nonconfcormance rate for each code and then a second to display the rate as a percentage (NC Rate By Date Per Code - Complete). Right now all the rate columns are ending up identical and as are the precentage columns though not the correct percentage version of the rate.
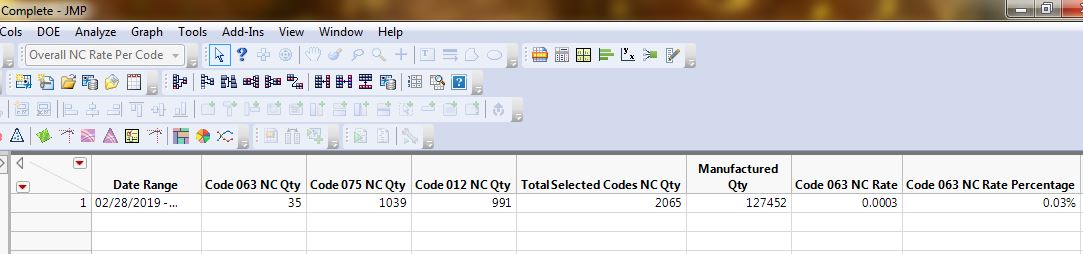
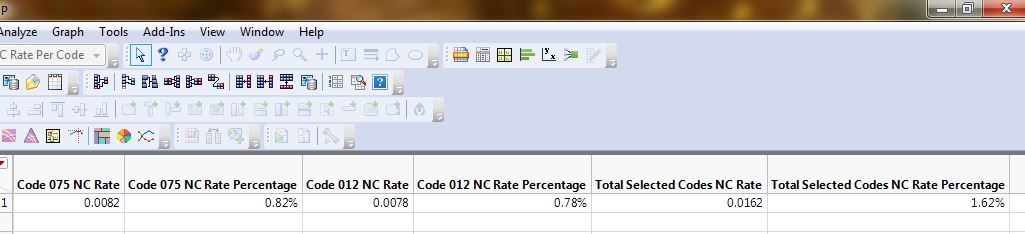
The loop is basically identical to one created at the very end of the script to summarize the nonconformance data over the entire date range (Overall NC Rate Per Code - Original, Overall NC Rate Per Code - Complete) which calculates correctly and I can't tell what's going wrong.
I attched screenshots of the metnioned tables and the script sections (codes = list of all entered codes as strings, SD and NR are table references)
//NC Rate By Date Per Code Section
//Calculate NC rates and percentages for entered codes if two or more codes are entered
		If(NItems(codes)>=2,
			For(c=2, c<=NItems(codes)+1, c++,

				//Add NC Rate column for each code
				NR<<New Column("Code " || codes[c-1] || " NC Rate", Numeric, Continuous, Formula(Round((Column(c)[] / :Manufactured Qty), 4)));

				//Establish reference column number for NC Rate Percentage columns
				col ref = (2*c) + NItems(codes);

				//Add NC Rate Percentage column for each code
				NR<<New Column("Code " || codes[c-1] || " NC Rate Percentage", Numeric, Continuous, Format("Percent", 12, 2), Formula(Column(col ref)[]));
			); //Closes NC rates and percentages For Loop

			//Calculate NC rates and percentages for All Selected Codes
			//Add :Total Selected Codes NC Rate
			NR<<New Column("Total Selected Codes NC Rate", Numeric, Continuous, Formula(Round(:Total Selected Codes NC Qty / :Manufactured Qty, 4)));

			//Add :Total Selected Codes NC Rate Percentage
			NR<<New Column("Total Selected Codes NC Rate Percentage", Numeric, Continuous, Format("Percent", 12, 2), Formula(Column(NCol(NR)-1)[]));
		); //Closes Two or More Codes If Loop

//Overall NC Rate Per Code Section
//Calculate NC rates and percentages for entered codes if two or more codes are entered
		If(NItems(codes)>=2,
			For(c=2, c<=NItems(codes)+1, c++,

				//Add NC Rate column for each code
				SD<<New Column("Code " || codes[c-1] || " NC Rate", Numeric, Continuous, Formula(Round((Column(c)[1] / :Manufactured Qty), 4)));

				//Establish reference column number for NC Rate Percentage columns
				col ref = (2*c) + NItems(codes);

				//Add NC Rate Percentage column for each code
				SD<<New Column("Code " || codes[c-1] || " NC Rate Percentage", Numeric, Continuous, Format("Percent", 12, 2), Formula(Column(col ref)[1]));
			); //Closes NC rates and percentages For Loop

			//Calculate NC rates and percentages for All Selected Codes
			//Add :Total Selected Codes NC Rate
			SD<<New Column("Total Selected Codes NC Rate", Numeric, Continuous, Formula(Round((:Total Selected Codes NC Qty / :Manufactured Qty), 4)));
			//Add :Total Selected Codes NC Rate Percentage
			SD<<New Column("Total Selected Codes NC Rate Percentage", Numeric, Continuous, Format("Percent", 12, 2), Formula(Column(NCol(SD)-1)[]));
		); //Closes Two or More Codes If Loop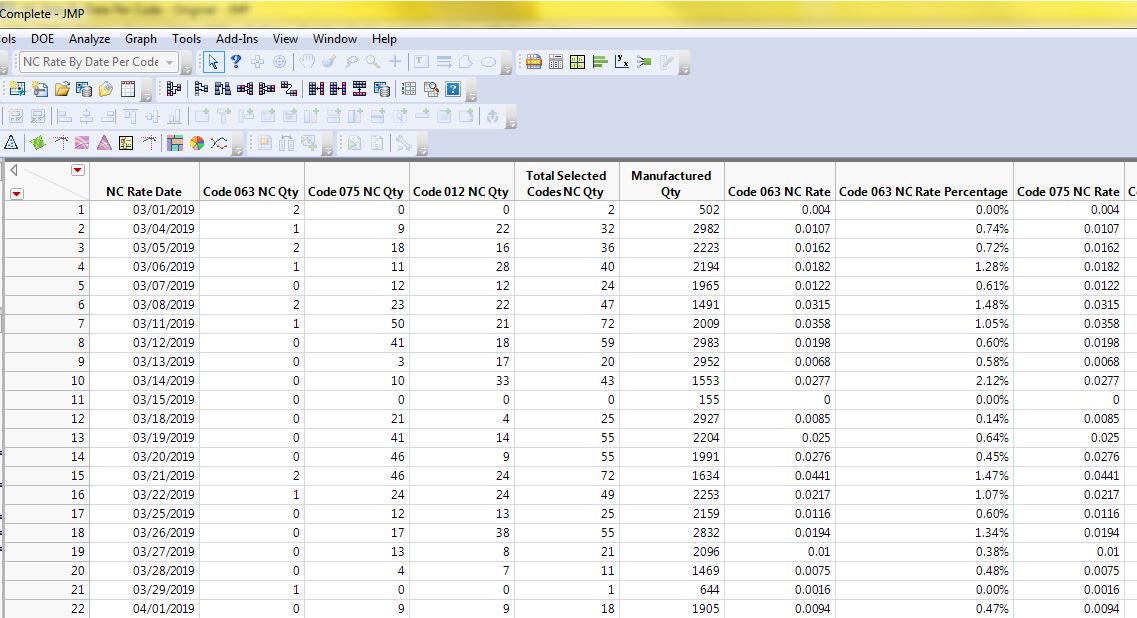
Accepted Solutions

- Mark as New
- Bookmark
- Subscribe
- Mute
- Subscribe to RSS Feed
- Get Direct Link
- Report Inappropriate Content
Re: Creating Formula Columns in a For Loop
There is a difference in the fomulas of the last two columns and the those created within your for loop. The last two columns reference the actual column to do the computing.
You should look at several of the columns formulas created by your for loop specification (see below)
NR<<New Column("Code " || codes[c-1] || " NC Rate", Numeric, Continuous, Formula(Round((Column(c)[] / :Manufactured Qty), 4)));
The formula will look like this, it will not have the value of c so the result you are getting will be the result of the final value of c.
Round((Column(c)[] / :Manufactured Qty), 4)
If you save this table and later open it in a new JMP session and rerun formulas those columns will be empty, JMP will not know the value of c.
You either need to modify your formula to use an expression that substitutes the value of c or change your script to store the computed values instead of the formula. The code below demonstartes how to use Set Each Value() to store the values and not the formulas.
tcol = NR<<New Column("Code " || codes[c-1] || " NC Rate", Numeric, Continuous);
tcol << Set Each Value(Round((Column(c)[] / :Manufactured Qty), 4)));
- Mark as New
- Bookmark
- Subscribe
- Mute
- Subscribe to RSS Feed
- Get Direct Link
- Report Inappropriate Content
Re: Creating Formula Columns in a For Loop
- Mark as New
- Bookmark
- Subscribe
- Mute
- Subscribe to RSS Feed
- Get Direct Link
- Report Inappropriate Content
Re: Creating Formula Columns in a For Loop
The script below will hopefully help you understand that as of JMP14 using a variable in a formula column can produce erroneous results because when the value of the variable changes, the formulas (and its values) change.
Regarding the last two formulas in your script:
- Total Selected Codes NC Rate - the formula used names columns, not a variable (c), so no issue.
-
Formula(Round((:Total Selected Codes NC Qty / :Manufactured Qty), 4)) - Total Selected Codes NC Rate Percentage - has the same problem as the for loop. Run your script and add another column and rerun formulas, the values of this precentage column will change because the formula depends upon the number of columns in the table. So once the number of columns change the formula and its values change.
Formula(Column(NCol(SD)-1)[])
Run the script below as described. It demonstrates what is happening in to your table formulas, and hence values. This script also includes a method to replace the variable in the formula with the variabes value using expressions. I typically use Set Each Value(), so if the source column is deleted the column is intact. Also note, this script uses c the column number. If I wanted the formula embedded, I recommend creating a new variable cnme = Column(c) << get name, then use Column(cnme) and expressions. Then if the table is reorganized, etc. the formula is as expected (intact). The script displayed below is attached.
Names Default to Here(1);

dt = Open("$Sample_Data/Big Class.jmp");

//will create formula columns for height and weight using a relative column number , c
//c will change, simulating a loop.
//highlight the blocks of code and follow the instructions

//--- Block 0: run this to embed the log window
_cw = Current Window();
_ifb = _cw << Find( If Box( 1 ) );
wait(0);
_ifb << Set( 1 );
//--- end Block 0


//--- Block 1: run it and look at the look at the embedded log
c=4; //height
dt << New Column( (column(c) << get name) ||" per age", Numeric, Continuous, Formula(Round(column(c)[] /:age,2) ) );
nc1 = ncol(dt);
show( c, nc1, (column(nc1) << get formula), column(nc1)[1::5]);
//--- end Block 1

//--- Block 2: run it and look at the look at the embedded log
c=5; //weight
dt << rerun formulas;
nc1 = ncol(dt);
show( c, nc1, (column(nc1) << get formula), column(nc1)[1::5]);
//--- end Block 2   See the log, the formula is the same, but c has changed so the formula is now using column 5 (c=5)
// for its calculation

//--- Block 3: run it and look at the look at the log
c=5; //height
dt << New Column( (column(c) << get name) ||" per age", Numeric, Continuous, Formula(Round(column(c)[] /:age,2) ) );
nc2 = ncol(dt);
show( c, nc2, (column(nc2) << get formula), column(nc2)[1::5]); //same formula as nc1
show(column(nc1)[1::5], column(nc2)[1::5]);
//--- end Block 3


//will use formula columns for weight and height using expressions column number

//--- Block 4: run it and look at the look at the log
c=4; //height
Eval ( Eval Expr(
  dt << New Column( (column(c) << get name) ||" per age using expr", Numeric, Continuous, Formula(Round(column(expr(c))[] /:age,2) ) )
));
nc3 = ncol(dt);
show( c, nc3, (column(nc3) << get formula), column(nc3)[1::5]);
//--- end Block 4   - note the formula now has the exact column number, it no longer relies on "c"


//--- Block 5: run it and look at the look at the log
c=5; //height
Eval(EvalExpr(
  dt << New Column( (column(c) << get name) ||" per age using expr", Numeric, Continuous, Formula(Round(column(Expr(c))[] /:age,2) ) );
));
nc4 = ncol(dt);
show( c, nc4, (column(nc4) << get formula), column(nc4)[1::5]); //not the same formula as nc3,
show(column(nc3)[1::5], column(nc4)[1::5]);
//--- end Block 5
- Mark as New
- Bookmark
- Subscribe
- Mute
- Subscribe to RSS Feed
- Get Direct Link
- Report Inappropriate Content
Re: Creating Formula Columns in a For Loop
Thanks for the extra explanation!
Recommended Articles
- © 2026 JMP Statistical Discovery LLC. All Rights Reserved.
- Terms of Use
- Privacy Statement
- Contact Us