- Subscribe to RSS Feed
- Mark Topic as New
- Mark Topic as Read
- Float this Topic for Current User
- Bookmark
- Subscribe
- Mute
- Printer Friendly Page
Discussions
Solve problems, and share tips and tricks with other JMP users.- JMP User Community
- :
- Discussions
- :
- Create Levey Jennings Chart

- Mark as New
- Bookmark
- Subscribe
- Mute
- Subscribe to RSS Feed
- Get Direct Link
- Report Inappropriate Content
Create Levey Jennings Chart
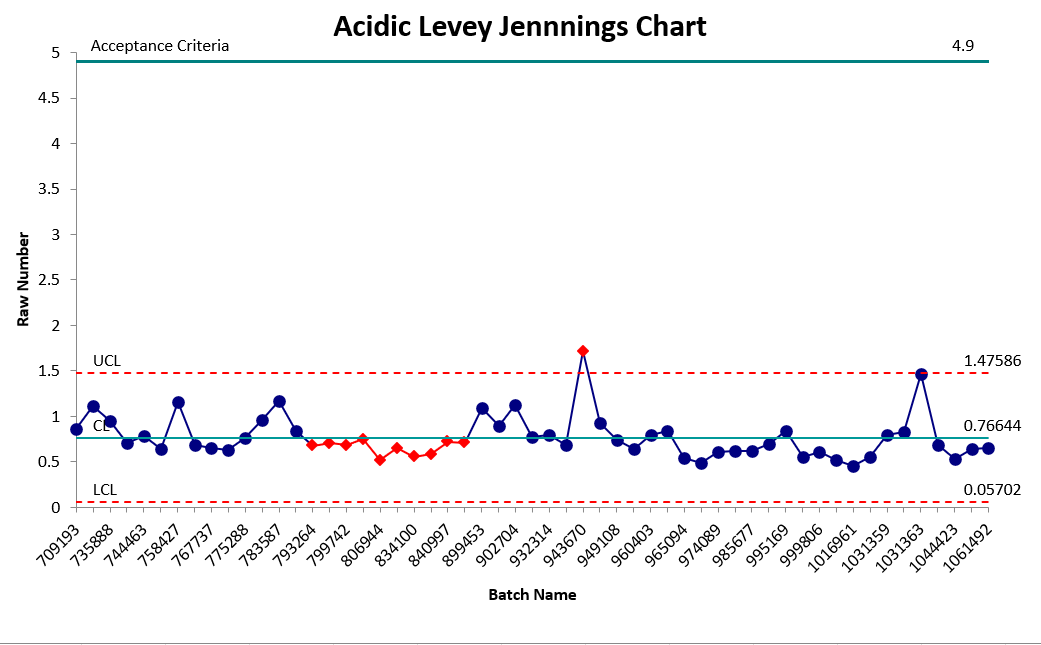
Hello all I am new to JMP and am using JMP 16. I have been using R and Excel for most my work and unfortunately lost a recording of how to do this via JMP the correct way. I need to make IMR and Levey Jennings charts for each attribute, but again I am unfamiliar with the Process. I have attached a picture of my data, and a screenshot of what I did via excel of the acidic Result display name for illustration. I essentially need to create it so the Y Axis is Raw Number and the X axis is batch name and the data being used for each graph is Result Display Name Thanks!
Accepted Solutions

- Mark as New
- Bookmark
- Subscribe
- Mute
- Subscribe to RSS Feed
- Get Direct Link
- Report Inappropriate Content
Re: Create Levey Jennings Chart
Welcome to the Discussion Community,
Both the IMR and the Levey Jennings charts are reachable through the
Help=>Statistics Index
Or you can just go to
Analyze=>Quality and Process=>Control Charts=>IMR Control Chart
or
Analyze=>Quality and Process=>Control Charts=>Levey Jennings Control Chart
Select Raw Number as the Y axis and Batch Name as the Sample Label/Subgroup
I strongly suggest that you take the time to read the Discovering JMP document available under the Help pull down menu
- Mark as New
- Bookmark
- Subscribe
- Mute
- Subscribe to RSS Feed
- Get Direct Link
- Report Inappropriate Content
Re: Create Levey Jennings Chart
Recommended Articles
- © 2026 JMP Statistical Discovery LLC. All Rights Reserved.
- Terms of Use
- Privacy Statement
- Contact Us