Turn on suggestions
Auto-suggest helps you quickly narrow down your search results by suggesting possible matches as you type.
- Don’t miss your chance to experience Discovery Summit Europe at our best available rate! Early bird registration through 31 Oct.
- Graph Builder Toolbar streamlines interactive graphing. Creates shortcuts on Report and GraphBuilder Helpers toolbars. Download and install the extension.
Options
- Subscribe to RSS Feed
- Mark Topic as New
- Mark Topic as Read
- Float this Topic for Current User
- Bookmark
- Subscribe
- Mute
- Printer Friendly Page
Discussions
Solve problems, and share tips and tricks with other JMP users.- User Community
- :
- Discussions
- :
- Correlation plots- How to split data by a grouping variable

Level I
- Mark as New
- Bookmark
- Subscribe
- Mute
- Subscribe to RSS Feed
- Get Direct Link
- Report Inappropriate Content
Correlation plots- How to split data by a grouping variable
Aug 18, 2023 12:05 PM
(2217 views)
I need help with plotting correlations.
Attached below is the dummy data set.
- Plot needs to have data for samples on X and Y axis based on Type
- Correlations at Gene level by sample, meaning take an average of reads by gene per sample and plot correlations of the average
- Correlations at read level by sample
Thank you.
1 ACCEPTED SOLUTION
Accepted Solutions
Level I
Solution
- Mark as New
- Bookmark
- Subscribe
- Mute
- Subscribe to RSS Feed
- Get Direct Link
- Report Inappropriate Content
Re: Correlation plots- How to split data by a grouping variable
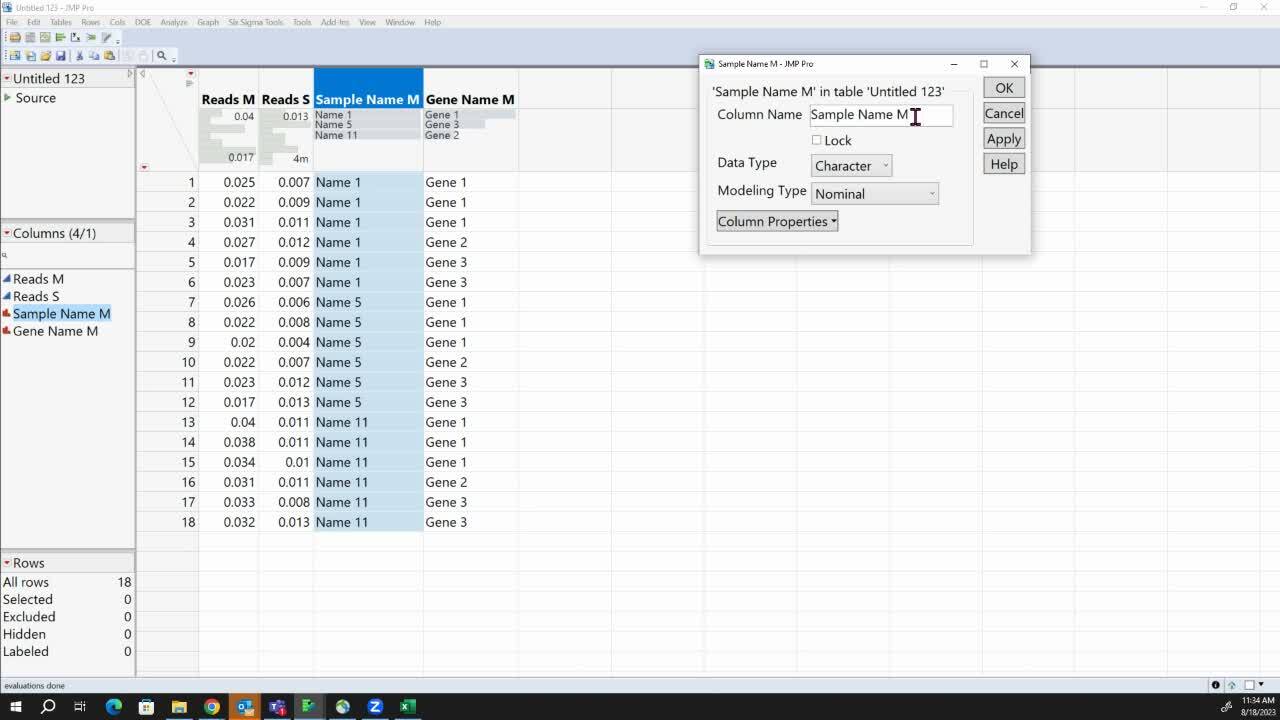
Received help from JMP Tech Lead. Below is a link to the video describing the steps.
1 REPLY 1
Level I
Solution
- Mark as New
- Bookmark
- Subscribe
- Mute
- Subscribe to RSS Feed
- Get Direct Link
- Report Inappropriate Content
Re: Correlation plots- How to split data by a grouping variable
Received help from JMP Tech Lead. Below is a link to the video describing the steps.
Recommended Articles
- © 2026 JMP Statistical Discovery LLC. All Rights Reserved.
- Terms of Use
- Privacy Statement
- Contact Us