- Don’t miss your chance to experience Discovery Summit Europe at our best available rate! Early bird registration through 31 Oct.
- Graph Builder Toolbar streamlines interactive graphing. Creates shortcuts on Report and GraphBuilder Helpers toolbars. Download and install the extension.
- JMP will suspend normal business operations for our Rest and Recharge Day on Friday, October 2, 2026.
Regular business hours will resume on Monday, October 5, 2026.
- Subscribe to RSS Feed
- Mark Topic as New
- Mark Topic as Read
- Float this Topic for Current User
- Bookmark
- Subscribe
- Mute
- Printer Friendly Page
Discussions
Solve problems, and share tips and tricks with other JMP users.- User Community
- :
- Discussions
- :
- Convert Date to a format used for chart reference lines

- Mark as New
- Bookmark
- Subscribe
- Mute
- Subscribe to RSS Feed
- Get Direct Link
- Report Inappropriate Content
Convert Date to a format used for chart reference lines
I want to take a list of dates from one table and use them as reference lines in an X by Y with Date as the X axis.
The date formats are in this format from a table: 12/18/2023 14:14. I would also like to add the label to each line from the same table. In this case it is EPOXI MT25700-02
The script for the chart shows what I would like be able to add from a table to the chart as reference lines. I would like to take the list of dates and lot numbers from a separate table and make them reference lines in a chart.
Bivariate(
	Y(:Value),
	X(:CreatedDateTime),
	Where(
		:ValueName == "Dispense Weight Chec" & :Site == "SAN" & :ProcessName ==
		"CLOUE Unload Station" & :EQNumber == "EQ-902280-001"
	),
	SendToReport(
		Dispatch(
			{},
			"CreatedDateTime",
			ScaleBox,
			{Add Ref Line(3785753640, "Solid", "Black", "EPOXI MT25700-02", 1)}
		),
		Dispatch({}, "Bivar Plot", FrameBox, {Frame Size(910, 194)})
	)
)

- Mark as New
- Bookmark
- Subscribe
- Mute
- Subscribe to RSS Feed
- Get Direct Link
- Report Inappropriate Content
Re: Convert Date to a format used for chart reference lines
If this is the form of the graph that you want
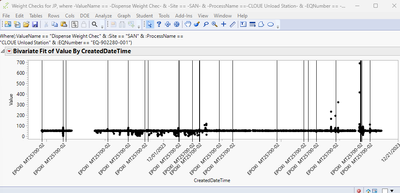
Here is the JSL that produces the above graph
Names Default To Here( 1 );
Data Table( "Weight Checks for JP" ) << Bivariate(
	Y( :Value ),
	X( :CreatedDateTime ),
	Where(
		:ValueName == "Dispense Weight Chec" & :Site == "SAN" & :ProcessName ==
		"CLOUE Unload Station" & :EQNumber == "EQ-902280-001"
	),
	SendToReport(
		Dispatch(
			{},
			"CreatedDateTime",
			ScaleBox,
			{Label Row( Label Orientation( "Angled" ) )}
		),
		Dispatch( {}, "Bivar Plot", FrameBox, {Frame Size( 910, 194 )} )
	)
);
BivR = Current Report()[Outline Box( 1 ), AxisBox( 2 )];
For( i = 1, i <= N Rows( Data Table( "Bottle Change Data" ) ), i++,
	BivR << Add Ref Line(
		Informat( Data Table( "Bottle Change Data" ):Date_Time[i], "m/d/y h:m" ),
		"Solid",
		"Black",
		Data Table( "Bottle Change Data" ):Description[i] || "  " ||
		Data Table( "Bottle Change Data" ):Part_Number[i],
		1
	)
);
Please use the <JSL> icon at the top of the Discussion Entry area when you are entering JSL. It makes the reading of the code much easier
Recommended Articles
- © 2026 JMP Statistical Discovery LLC. All Rights Reserved.
- Terms of Use
- Privacy Statement
- Contact Us