- New to JMP? Join us Sept. 23-24 for the Early User Edition of Discovery Summit, tailor-made for new users. Register now for free!
- Your voice matters! Tell us how you prefer to receive JMP updates, so we can tailor our communication to your needs. Take short survey.
- See how to access JMP Marketplace - and - find, create & share add-ins to extend your JMP. Watch video.
- Subscribe to RSS Feed
- Mark Topic as New
- Mark Topic as Read
- Float this Topic for Current User
- Bookmark
- Subscribe
- Mute
- Printer Friendly Page
Discussions
Solve problems, and share tips and tricks with other JMP users.- JMP User Community
- :
- Discussions
- :
- Re: Contour plot weird problem

- Mark as New
- Bookmark
- Subscribe
- Mute
- Subscribe to RSS Feed
- Get Direct Link
- Report Inappropriate Content
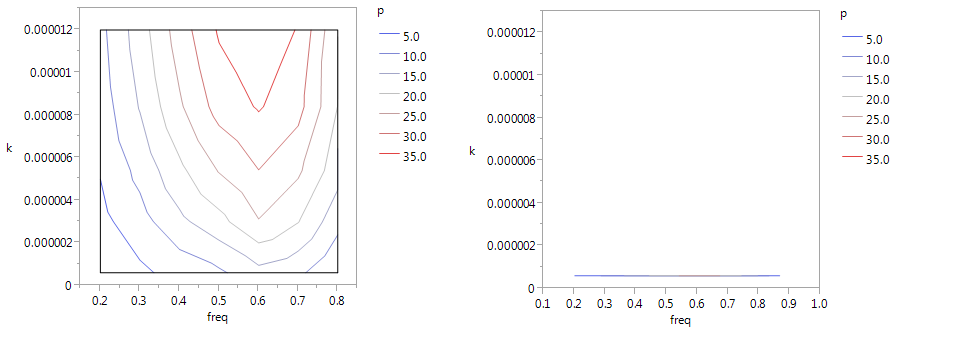
Contour plot weird problem
Hi,
I used JMP for a few years and recently got a strange problem during a contour plot. Please see attached JMP file (test.jmp).
The data was plotted correctly in matlab. In the attached file, if I just plotted freq from 0.2 to 0.8, everything looked good (as left image). But if I included freq=0.9, the plot is changed completely (actually, the plot shrunk to a single line, as right image). I also noticed even I didn't add new data, but changed the exist data slightly, the plot was changed completely to a line, i.e. I changed one data freq from 0.8 to 0.9. It's so weird to me.
Can anyone give me a help?
Thanks a lot!
-Lei
- Mark as New
- Bookmark
- Subscribe
- Mute
- Subscribe to RSS Feed
- Get Direct Link
- Report Inappropriate Content
Re: Contour plot weird problem
Hi Lou,
Thanks for looking into it. I am glad to get the contour plot :-). I did contour plot with other software. But I just wanted to make all my contour plot in my slides consistent. I will submit a technical support and keep everyone updated.
Thanks,
-Lei (I don't know why the forum automatically change my name "Lei" to "she", another weird thing.)

- Mark as New
- Bookmark
- Subscribe
- Mute
- Subscribe to RSS Feed
- Get Direct Link
- Report Inappropriate Content
Re: Contour plot weird problem
Hi L.
I may have found the problem. I added a new column (Column 4) that was just Column 2 * 1,000,000,000 and I was able to obtain the contour plot.

- Mark as New
- Bookmark
- Subscribe
- Mute
- Subscribe to RSS Feed
- Get Direct Link
- Report Inappropriate Content
Re: Contour plot weird problem
Hi Lou,
Interesting, I did what you said. It worked. Maybe the original column 2 value is too small? anyway, I also submitted the question to JMP technical support. Before getting reply from them, your method worked pretty well.
Thanks,
-Lei

- Mark as New
- Bookmark
- Subscribe
- Mute
- Subscribe to RSS Feed
- Get Direct Link
- Report Inappropriate Content
Re: Contour plot weird problem
Hi Lei,
Contour Plot computes a triangulation of the data as a basis for doing the interpolation for contours. It looks like the triangulation step is failing in this case due to the different scales for X & Y.
There is an option under the red-triangle menu for "Transform", with two options. The default is None, and it will triangulate without any scaling of the data. If you change this to "Range Normalized", each axis will be scaled independently prior to the triangulation, and this appears to resolve the issue for this example.
Changing the Transform can sometimes cause changes in the contours (due to changes in the triangulation), but in this case with data specified on a grid there should be no difference.
-Dan
- « Previous
-
- 1
- 2
- Next »
Recommended Articles
- © 2026 JMP Statistical Discovery LLC. All Rights Reserved.
- Terms of Use
- Privacy Statement
- Contact Us