- New to JMP? Join us Sept. 23-24 for the Early User Edition of Discovery Summit, tailor-made for new users. Register now for free!
- Your voice matters! Tell us how you prefer to receive JMP updates, so we can tailor our communication to your needs. Take short survey.
- See how to access JMP Marketplace - and - find, create & share add-ins to extend your JMP. Watch video.
- Subscribe to RSS Feed
- Mark Topic as New
- Mark Topic as Read
- Float this Topic for Current User
- Bookmark
- Subscribe
- Mute
- Printer Friendly Page
Discussions
Solve problems, and share tips and tricks with other JMP users.- JMP User Community
- :
- Discussions
- :
- Re: Contour plot weird problem

- Mark as New
- Bookmark
- Subscribe
- Mute
- Subscribe to RSS Feed
- Get Direct Link
- Report Inappropriate Content
Contour plot weird problem
Hi,
I used JMP for a few years and recently got a strange problem during a contour plot. Please see attached JMP file (test.jmp).
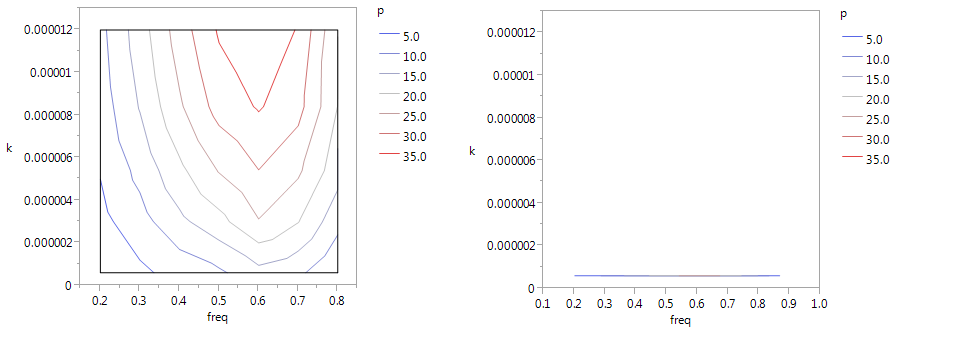
The data was plotted correctly in matlab. In the attached file, if I just plotted freq from 0.2 to 0.8, everything looked good (as left image). But if I included freq=0.9, the plot is changed completely (actually, the plot shrunk to a single line, as right image). I also noticed even I didn't add new data, but changed the exist data slightly, the plot was changed completely to a line, i.e. I changed one data freq from 0.8 to 0.9. It's so weird to me.
Can anyone give me a help?
Thanks a lot!
-Lei

- Mark as New
- Bookmark
- Subscribe
- Mute
- Subscribe to RSS Feed
- Get Direct Link
- Report Inappropriate Content
Re: Contour plot weird problem
I ran the same analysis and extended the x-axis to include 0.9 and got a nice looking plot. What version of JMP are you using? I'm using v12. Perhaps you accidentally rescaled the y axis as well.

- Mark as New
- Bookmark
- Subscribe
- Mute
- Subscribe to RSS Feed
- Get Direct Link
- Report Inappropriate Content
Re: Contour plot weird problem
Thanks, I reinstall the JMP12. It seemed the problem solved.
- Mark as New
- Bookmark
- Subscribe
- Mute
- Subscribe to RSS Feed
- Get Direct Link
- Report Inappropriate Content
Re: Contour plot weird problem
Hi, dlee0416,
Sorry, I might draw my conclusion too soon. After JMP re-installation, I actually still got the problem. In your plot, the column1 is still from 0.2 to 0.8. Can you please try add 0.9 data and see if you have similar problem?
Thanks,
-Lei
- Mark as New
- Bookmark
- Subscribe
- Mute
- Subscribe to RSS Feed
- Get Direct Link
- Report Inappropriate Content
Re: Contour plot weird problem
Guleiss,
I plotted the data you provided and there is no data >0.8. In my original plot I just manually changed the axis settings.

- Mark as New
- Bookmark
- Subscribe
- Mute
- Subscribe to RSS Feed
- Get Direct Link
- Report Inappropriate Content
Re: Contour plot weird problem
Here's the code to do this in JSL:
Contour Plot(
X( :Column 1, :Column 2 ),
Y( :Column 3 ),
Show Data Points( 0 ),
Fill Areas( 0 ),
Label Contours( 0 ),
Transform( "None" ),
Specify Contours(
Min( 5 ),
Max( 35 ),
N( 7 ),
Contour( 1, 5, -2380261 ),
Contour( 2, 10, -1998002 ),
Contour( 3, 15, -1285756 ),
Contour( 4, 20, -58112 ),
Contour( 5, 25, -7246852 ),
Contour( 6, 30, -12018696 ),
Contour( 7, 35, -16125962 )
),
SendToReport( Dispatch( {}, "1", ScaleBox, {Max( 0.9 )} ) )
);
- Mark as New
- Bookmark
- Subscribe
- Mute
- Subscribe to RSS Feed
- Get Direct Link
- Report Inappropriate Content
Re: Contour plot weird problem
Hi dlee0416,
Thanks for your reply. Sorry, I forgot to mention I excluded 0.9 data in the .jmp file. It makes curve looks weird. They are actually in the .jmp file. Please help. I also tried these data with excel contour plot and looked good.
Thanks,
-Lei
- Mark as New
- Bookmark
- Subscribe
- Mute
- Subscribe to RSS Feed
- Get Direct Link
- Report Inappropriate Content
Re: Contour plot weird problem
Guleiss,
I see your problem. I have tried to create a meaningful contour plot and for some unknown reason I get the same result when adding the 0.9 data. I'm attaching a jmp file showing several plots that definitely show the data and the surface. I even used another program and got a very nice contour map. I think you might have stumbled into a bug. I'd suggest contact Technical Support. Sorry I couldn't be of more help. Please let me know or private message when the final 'fix' is determined.
Dave
- Mark as New
- Bookmark
- Subscribe
- Mute
- Subscribe to RSS Feed
- Get Direct Link
- Report Inappropriate Content
Re: Contour plot weird problem
Hi dlee0416,
Thanks for your time to look into it.It's just weird. I never have this problem before. Other tools like matlab or excel are fine with this contour plot. Thanks for your suggestion. I may submit a technical support as a bug.
Thanks,
-Lei

- Mark as New
- Bookmark
- Subscribe
- Mute
- Subscribe to RSS Feed
- Get Direct Link
- Report Inappropriate Content
Re: Contour plot weird problem
Hi L.
I see the same funny behavior as you do when I un-exclude the 0.9 rows using the Graph>Contour Plot platform. Tech support should be alerted.
When I Fit Model with Column 3 as the response and Column 1 and Column 2 as factors I am able to get the contour plot

Recommended Articles
- © 2026 JMP Statistical Discovery LLC. All Rights Reserved.
- Terms of Use
- Privacy Statement
- Contact Us