- Subscribe to RSS Feed
- Mark Topic as New
- Mark Topic as Read
- Float this Topic for Current User
- Bookmark
- Subscribe
- Mute
- Printer Friendly Page
Discussions
Solve problems, and share tips and tricks with other JMP users.- JMP User Community
- :
- Discussions
- :
- Re: Connective letters from summary statistics
- Mark as New
- Bookmark
- Subscribe
- Mute
- Subscribe to RSS Feed
- Get Direct Link
- Report Inappropriate Content
Connective letters from summary statistics
Hi all
I am currently working on a research project for which i had to calculate some parameters (aka I have their means and standard deviation but not a full table of all repeats). I am trying to do a Tukey HSD test to compare these means and obtain a connective letters report but this seems to be rather impossible (as my table only contains 'one repeat' per measurement/calculation and I do not seem to be able to tell jump that the 2 columns in my data file are already the mean and standard deviation instead of just a random measurement). Does anyone know how to fix this/has a script for this? I am currently working on JMP Pro 16. In the attachment is an example of the datafile
Kind regards
- Mark as New
- Bookmark
- Subscribe
- Mute
- Subscribe to RSS Feed
- Get Direct Link
- Report Inappropriate Content
Re: Connective letters from summary statistics
I don't see how this is possible. You already have means and standard deviations, but there is no data on the sample size in each group nor do we know anything about the distribution shapes. The Tukey HSD report is based on the ANOVA using the underlying data. You can't go directly from means and standard deviations to testing for significant differences without some additional information. If you are willing to simulate data within each group (e.g. by assuming normal distributions with the given means and standard deviations and assuming sample sizes), then you can do the ANOVA and Tukey HSD. But I don't believe you can go from what you have without additional assumptions/data. If I'm wrong, someone will correct me.
- Mark as New
- Bookmark
- Subscribe
- Mute
- Subscribe to RSS Feed
- Get Direct Link
- Report Inappropriate Content
Re: Connective letters from summary statistics
@dale_lehman is correct that you do need more information. If you know the sample size, you can make the calculations. Here is a link to a script that will perform the necessary calculations. ANOVA from Data Summary
- Mark as New
- Bookmark
- Subscribe
- Mute
- Subscribe to RSS Feed
- Get Direct Link
- Report Inappropriate Content
Re: Connective letters from summary statistics
Ofcourse I have the sample sizes as well and the assumption of a normal distribution should be valid. I tried using that script before but it does not work as described in the article (no screens popping up or anything). The script is alsof just one line of programming (unless I'm mistaking ofcourse)
- Mark as New
- Bookmark
- Subscribe
- Mute
- Subscribe to RSS Feed
- Get Direct Link
- Report Inappropriate Content
Re: Connective letters from summary statistics
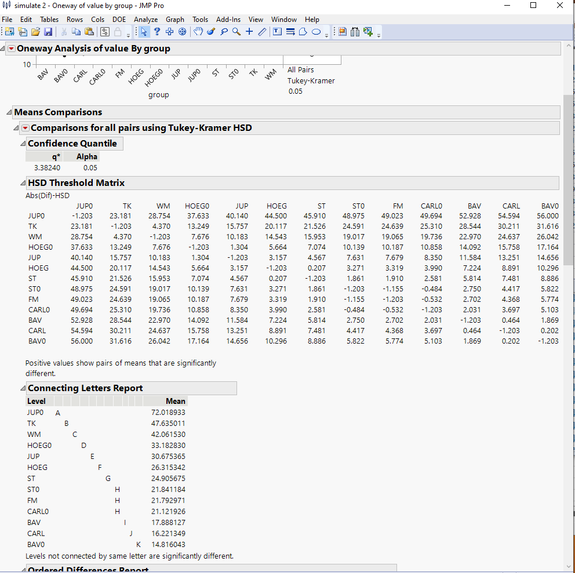
given a data table setup like this:
Where the samples is the sample size of the groups, you can then run the below script
Names Default To Here( 1 );
dt = Current Data Table();
nw = New Table( "simulate", New Column( "group", character ), New Column( "value" ) );
For( i = 1, i <= N Rows( dt ), i++,
	For( k = 1, k <= dt:samples[k], k++,
		nw << add rows( 1 );
		rr = N Rows( nw );
		nw:group[rr] = dt:group[i];
		nw:value[rr] = Random Normal( dt:mean[i], dt:stdev[i] );
	)
);
nw << Oneway(
	Y( :value ),
	X( :group ),
	All Pairs( 1 ),
	Wilcoxon Each Pair( 1 ),
	SendToReport(
		Dispatch(
			{},
			"Nonparametric Comparisons For Each Pair Using Wilcoxon Method",
			OutlineBox,
			{Close( 1 )}
		)
	)
);
And get the below results
- Mark as New
- Bookmark
- Subscribe
- Mute
- Subscribe to RSS Feed
- Get Direct Link
- Report Inappropriate Content
Re: Connective letters from summary statistics
Hi @txnelson
This would indeed be a solution to circumvent the problem. However, due to the simulation, the connective letters report changes from run to run (as you can see in the screenshot below and is expected from a method using this simulation). This still makes it impossible to find the actually significant differences.
- Mark as New
- Bookmark
- Subscribe
- Mute
- Subscribe to RSS Feed
- Get Direct Link
- Report Inappropriate Content
Re: Connective letters from summary statistics
Short of increasing the sample size or sunning the script 100 or 1000 times and then averaging the results someway, you are stuck with the results you have.
- Mark as New
- Bookmark
- Subscribe
- Mute
- Subscribe to RSS Feed
- Get Direct Link
- Report Inappropriate Content
Re: Connective letters from summary statistics
Hi @Crown ,
i am not sure why the solutions offered so far are not working for you.
please try the attached file. open it and run the script called Anova.
in the window that opens select "Enter as data table" and click "OK".
Next, allocate the columns in to their respective roles and click ok.
this should give you the result you are looking for. there is also an Ancova version of analysis from summary data if you need.
let us know if this works out for you.
Ron
Recommended Articles
- © 2026 JMP Statistical Discovery LLC. All Rights Reserved.
- Terms of Use
- Privacy Statement
- Contact Us


