- Subscribe to RSS Feed
- Mark Topic as New
- Mark Topic as Read
- Float this Topic for Current User
- Bookmark
- Subscribe
- Mute
- Printer Friendly Page
Discussions
Solve problems, and share tips and tricks with other JMP users.- JMP User Community
- :
- Discussions
- :
- Re: Comparison of dose-response curves for different endpoints within the same g...
- Mark as New
- Bookmark
- Subscribe
- Mute
- Subscribe to RSS Feed
- Get Direct Link
- Report Inappropriate Content
Comparison of dose-response curves for different endpoints within the same group
Good afternoon,
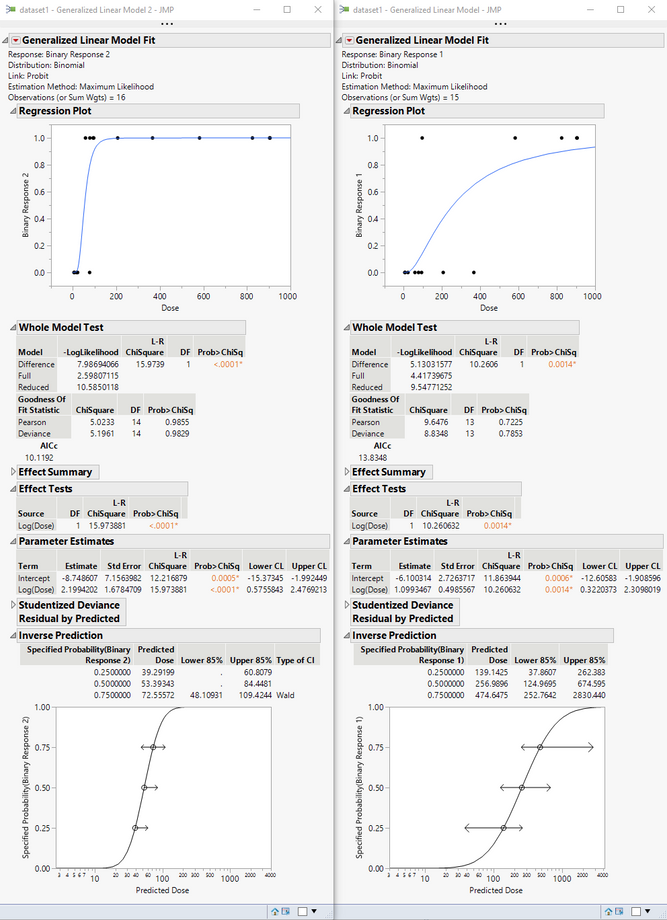
I have a dataset where a group has been exposed to different doses of a compound, and two different endpoints of interest (both binary responses) were measured (data table is below and .jmp file with dataset is attached). I have run individual dose-response analyses on each to estimate the ED50 (log-probit fit using GLM). I would also like to compare the dose response curves, but am not sure of the best way to approach this since the two endpoints are in the same population. Any guidance would be greatly appreciated.
- Mark as New
- Bookmark
- Subscribe
- Mute
- Subscribe to RSS Feed
- Get Direct Link
- Report Inappropriate Content
Re: Comparison of dose-response curves for different endpoints within the same group
What does "would also like to compare the dose response curves" mean to you? In what way would you compare them? What aspect of the curves is to be compared?
- Mark as New
- Bookmark
- Subscribe
- Mute
- Subscribe to RSS Feed
- Get Direct Link
- Report Inappropriate Content
Re: Comparison of dose-response curves for different endpoints within the same group
Hi,
Sorry for the delayed response. In general, I would like to know if it is possible to say statistically if different dose response models best describe the data. If different models are best to describe data, I would like to be able to compare specific parameters such as the ED50 and possibly the slope.
Thanks for your help.
- Mark as New
- Bookmark
- Subscribe
- Mute
- Subscribe to RSS Feed
- Get Direct Link
- Report Inappropriate Content
Re: Comparison of dose-response curves for different endpoints within the same group
I am still confused because your example includes more than one response, but only one type of model (binary GLM with Probit link function).
One approach for comparing models is to form a hierarchy of terms and then test sub-models within this hierarchy and then evaluate the overall change in model performance or the significance of individual terms. For example, assessing the linear degradation of a drug substance might postulating a model of potency = intercept + batch + time + batch*time + error. This model is hierarchical. If the batch*time term is deemed not significant, then it can be removed to make a better model and batch-dependent slopes are unnecessary.
Another approach is to use a model selection criterion such as AICc for comparison (smaller is better). It is not a statistic for inference, though. The assumption is that all models use the same Y but the models can vary (linear regression, partition, neural network, et cetera).
- Mark as New
- Bookmark
- Subscribe
- Mute
- Subscribe to RSS Feed
- Get Direct Link
- Report Inappropriate Content
Re: Comparison of dose-response curves for different endpoints within the same group
Hi,
Sorry for the confusion. I did not mean two separate model types - I would like to use a log-probit to fit the dose-response data for each response type.
What I want to know is if the dose-response fits for the two responses are different from one another - i.e. is the ED50 for the first response lower than that for the other response? I thought about putting response in as a dummy variable, but wasn't sure if this was correct since the responses are paired in the same population.
Thanks very much.
- Mark as New
- Bookmark
- Subscribe
- Mute
- Subscribe to RSS Feed
- Get Direct Link
- Report Inappropriate Content
Re: Comparison of dose-response curves for different endpoints within the same group
OK, thanks for clarifying your need.
I think that the simplest way is to introduce a Curve variable and cross it with the other terms in the model. For example, if the linear predictor of my model is B0 + B1 + B1^2, I would expand it with terms to this form B0 + Curve + B1 + B1^2 + Curve*B1 + Curve*B1^s. The effect tests will tell you if the estimates depend on the curve. If the estimates of the new terms are not significant, then there is no such difference in the curves.
- Mark as New
- Bookmark
- Subscribe
- Mute
- Subscribe to RSS Feed
- Get Direct Link
- Report Inappropriate Content
Re: Comparison of dose-response curves for different endpoints within the same group
I am still confused, after all. My previous answer is about comparing the curves (i.e., models), but you want to know if the inverse prediction (e.g., ED50) is different
- Mark as New
- Bookmark
- Subscribe
- Mute
- Subscribe to RSS Feed
- Get Direct Link
- Report Inappropriate Content
Re: Comparison of dose-response curves for different endpoints within the same group
Ultimately comparing the inverse predictions is what I am interested in, but I would also like to know how to compare the curves. Your previous reply was helpful in that regard.
Recommended Articles
- © 2026 JMP Statistical Discovery LLC. All Rights Reserved.
- Terms of Use
- Privacy Statement
- Contact Us


