- Instantly extract effect sizes, F-ratios, and FDR-adjusted p-values from your models with the Calculate Effects Sizes extension, available now in the JMP Marketplace!
- New to JMP? Join us Sept. 23-24 for the Early User Edition of Discovery Summit, tailor-made for new users. Register now for free!
- See how to use the JMP Marketplace – Free tools to expand JMP capabilities. Register. July 10, 2 pm US Eastern Time.
- Subscribe to RSS Feed
- Mark Topic as New
- Mark Topic as Read
- Float this Topic for Current User
- Bookmark
- Subscribe
- Mute
- Printer Friendly Page
Discussions
Solve problems, and share tips and tricks with other JMP users.- JMP User Community
- :
- Discussions
- :
- Comparing DoEs- Why D/G/A/I- efficiencies are all the SAME and terribly LOW?

- Mark as New
- Bookmark
- Subscribe
- Mute
- Subscribe to RSS Feed
- Get Direct Link
- Report Inappropriate Content
Comparing DoEs- Why D/G/A/I- efficiencies are all the SAME and terribly LOW?
Hi,
I am working on Custom DoE (JMP16). I have 4 factors (1 continuous and 3 discrete num, with constraints). I have 1 response. I know these 4 factors are important and have interactions. My goal is to optimize the response to find the optimal factor levels that result in the highest efficiency possible. I included all quadratic and interaction effects.
I am using the I-optimality since this is not a screening design.
- The first design (v5) has no replicates. It has 18 runs total.
- The second design (v6) has duplicates. It has a total of 36 runs (I augmented it).
- The third design (v7) has triplicates. It has a total of 54 runs (I augmented it).
For this experiment that I plan to do, it is easier for me to add duplicates or triplicates (of the same conditions) once in the lab. That's why I don't mind if I have more runs, as long as these are of the same conditions (duplicates or triplicates), because I am able to run them all together as long as these are replicates of the same initial 18 runs.
[If instead I was to simply use the "add replicate runs" feature, then JMP adds way too many more runs with too many different conditions for me to test (resources limitation). For example, when adding just 4 replicate runs, JMP generates a design with a default total of runs =27, which is too many different conditions to test...That's why I decided to replicate my entire design instead using the augment feature.]
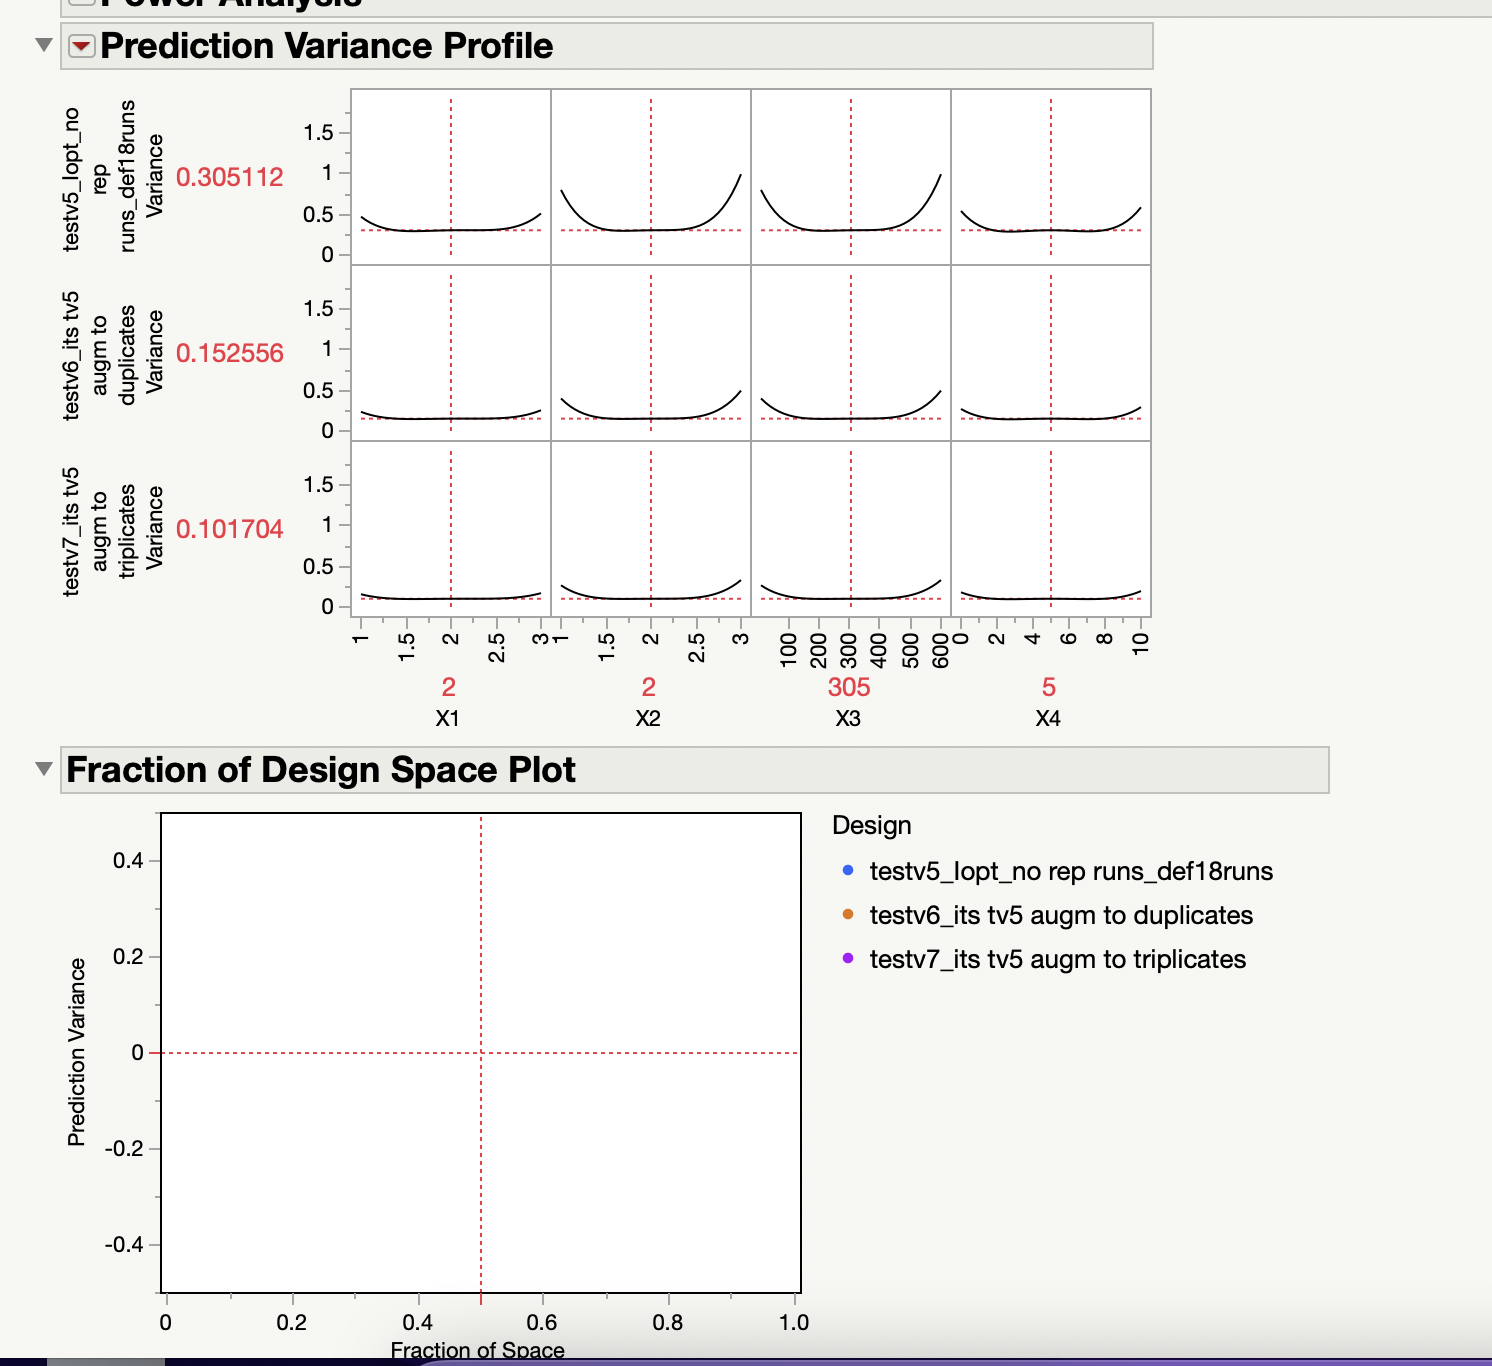
- I am comparing designs v5, v6 and v7 (attached). However, my "Fraction of Design Space" plot is blank. Why is it blank? or is the data very small that I can't see it?
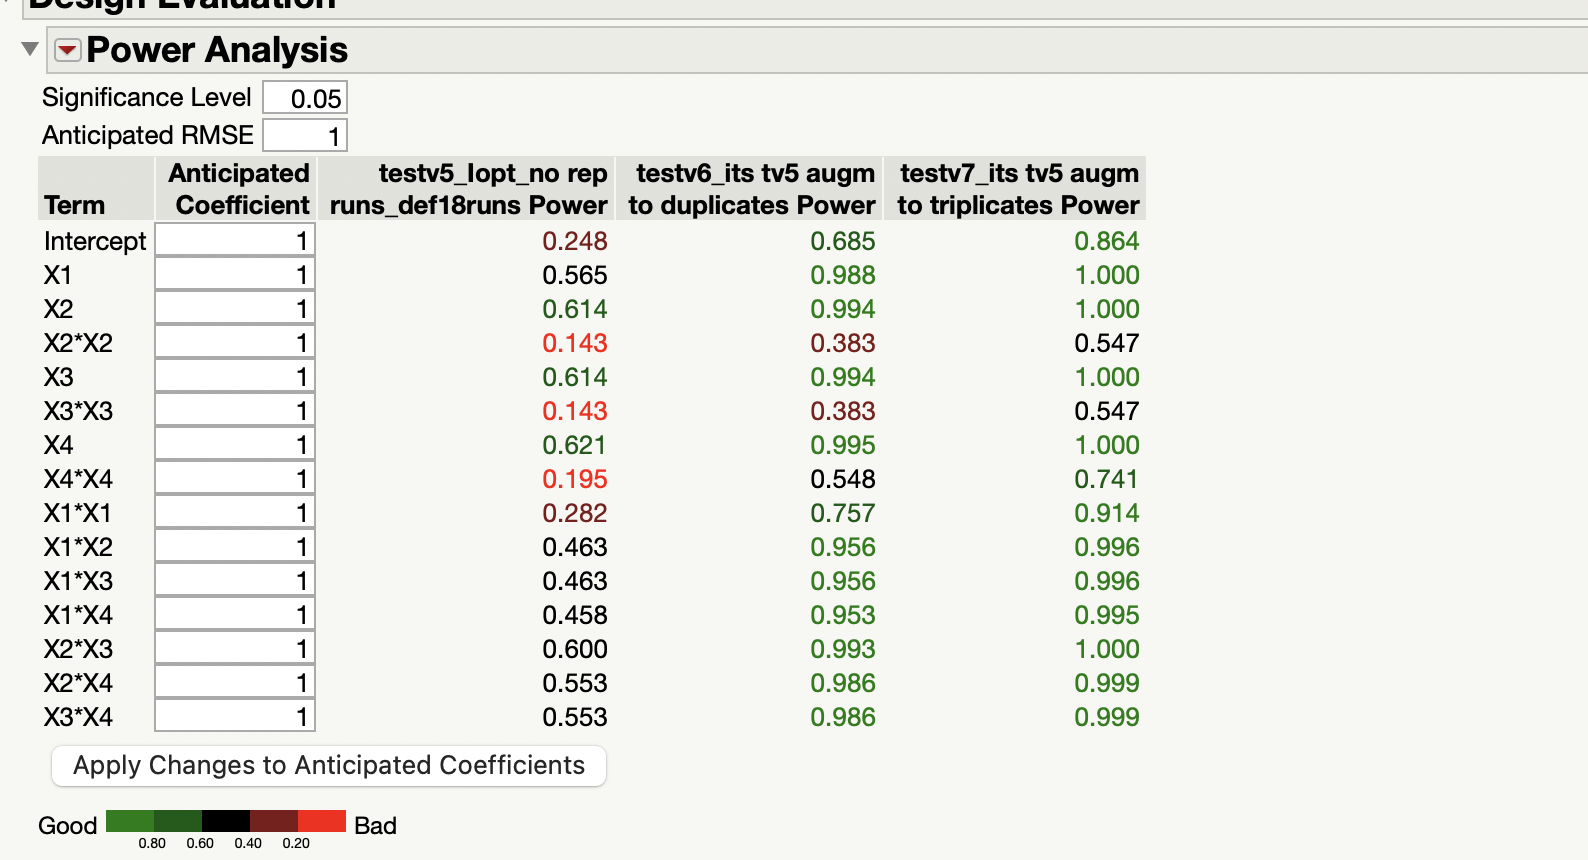
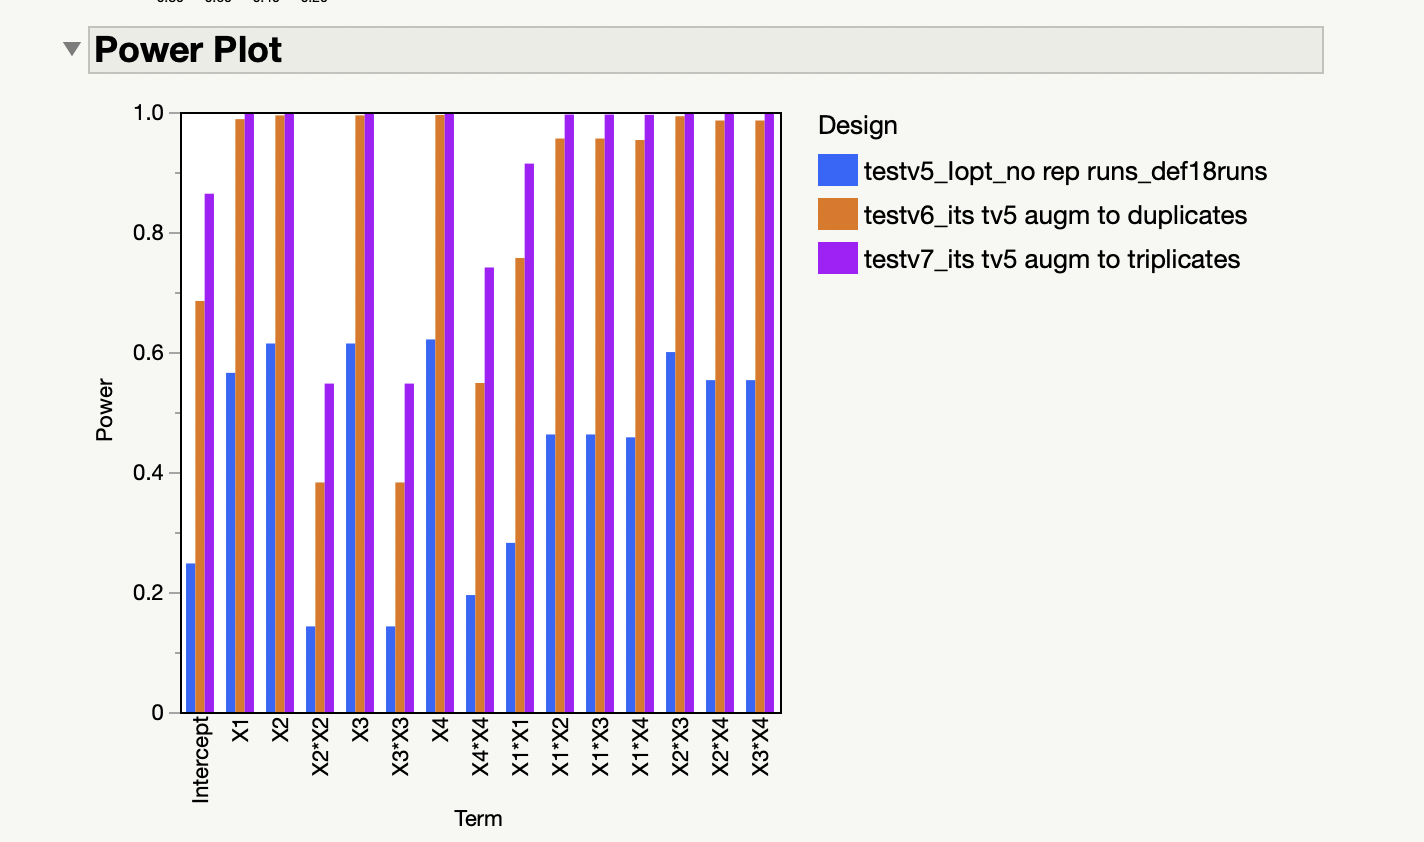
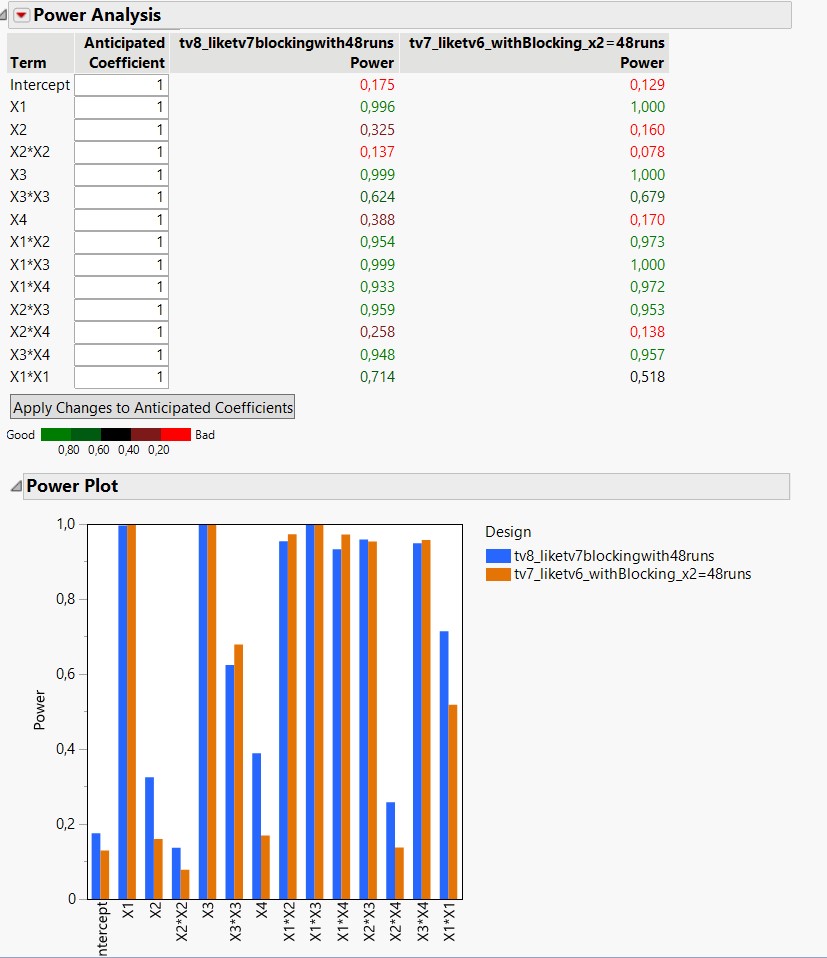
- The "Power Analysis" and "Power Plot" look pretty good for v6 and v7. But, I am interested in optimizing the response anyway (not in the main effects).
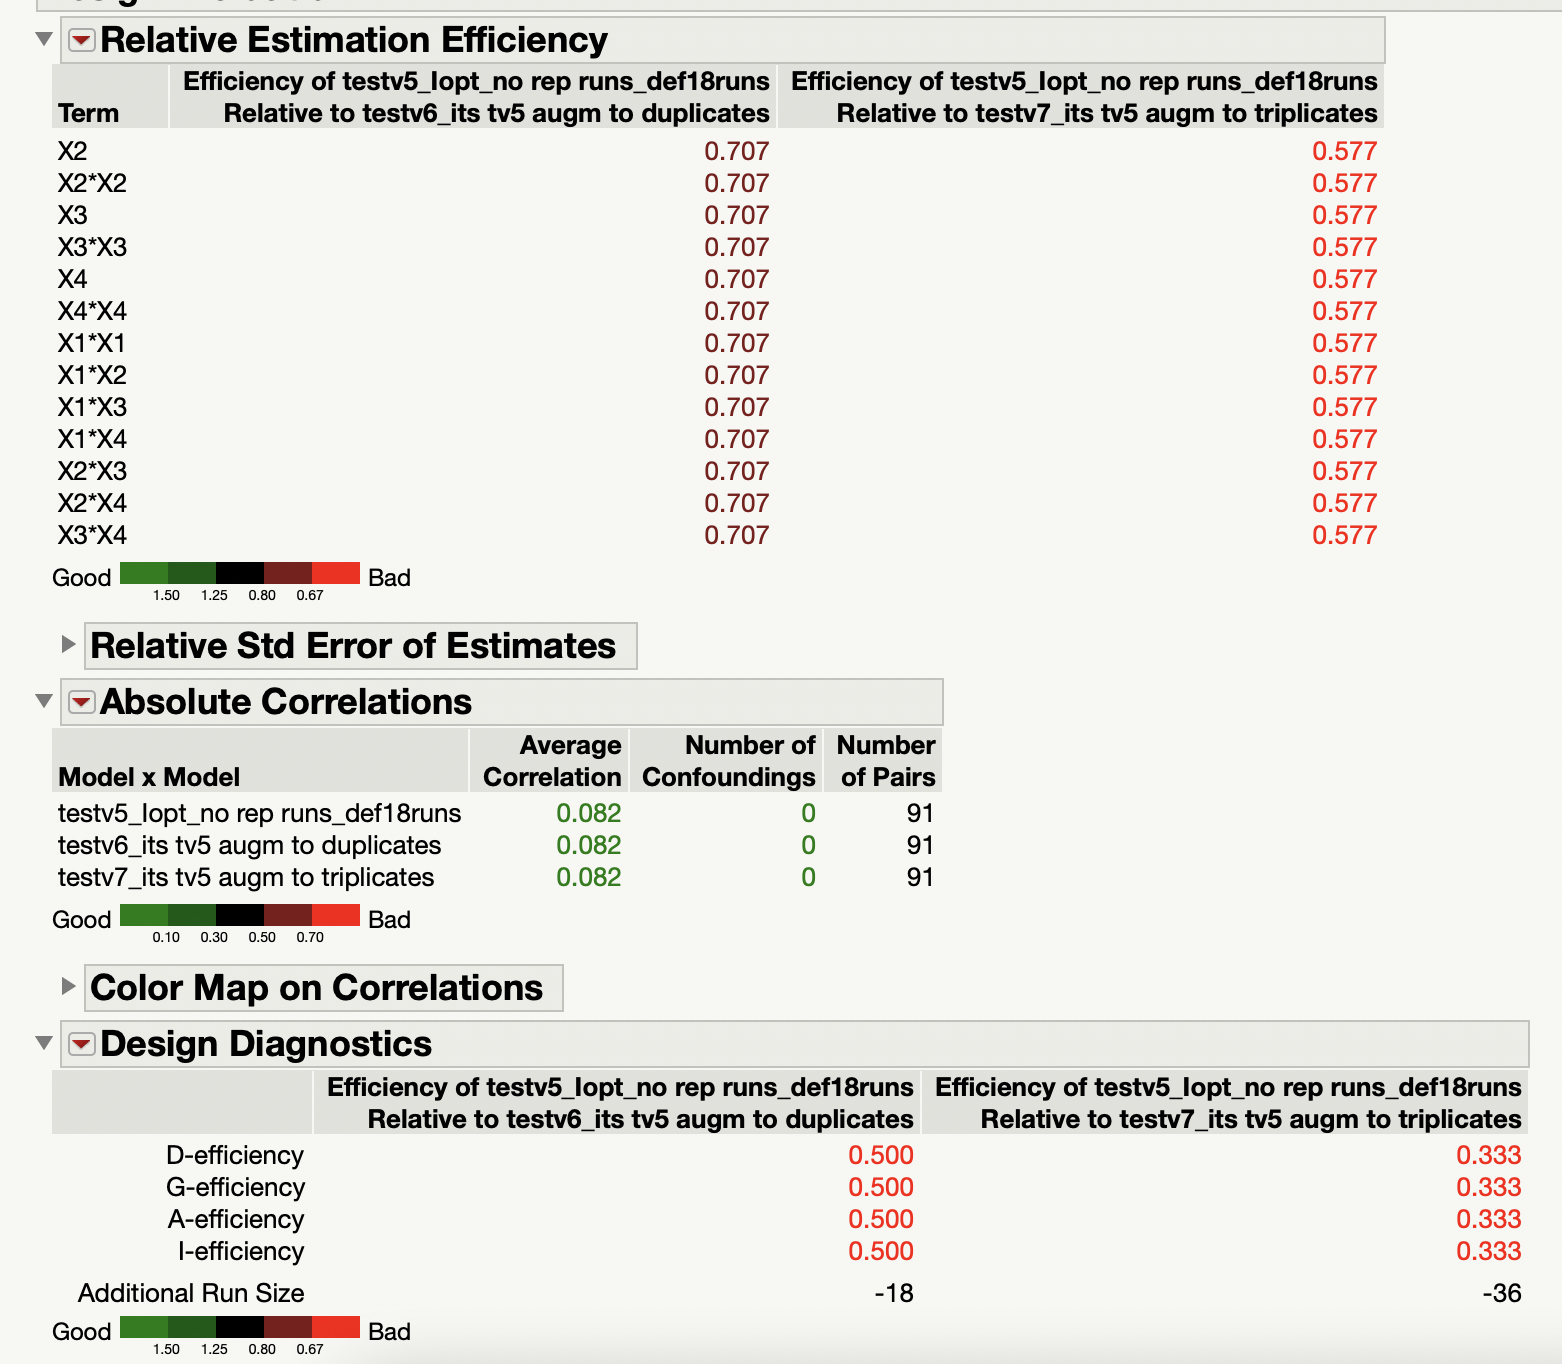
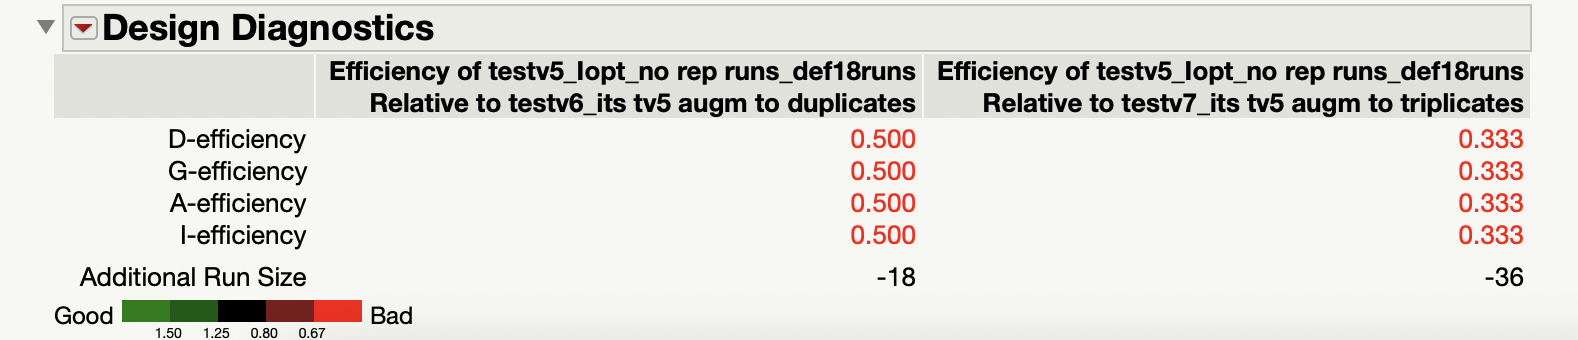
- However, the D/G/A/I- efficiencies are terribly POOR and all are the SAME. Are these all the same because design v6 is a duplicate of design v5, and design v7 is a triplicate of design v5? and why are these values so LOW (0.5 and 0.3)? Are my designs bad?
I tried to look this up but, all I found on the DOE guide is:
"Relative efficiency values that exceed 1 indicate that the reference design is preferable for the given measure. Values less than 1 indicate that the design being compared to the reference design is preferable. The 16-run design has lower efficiency than the other two designs across all metrics, indicating that the larger designs are preferable."
But, this didn't help me much.
Thank you in advance!!
- Tags:
- macOS
Accepted Solutions

- Mark as New
- Bookmark
- Subscribe
- Mute
- Subscribe to RSS Feed
- Get Direct Link
- Report Inappropriate Content
Re: Comparing DoEs- Why D/G/A/I- efficiencies are all the SAME and terribly LOW?
Hi @ADouyon,
For your first question, the fraction of design space plot is blank for each individual design, which is weird. Looking at your disallowed combinations script, there may be a problem, as the name of your factors in the datatable are not the same in your "Disallowed combinations" script (so JMP may be lost in interpreting what is "Pulses" and which column it is for example).
When I change the "Disallowed combinations" script with anonymized names for columns (X1, X2, X3, X4), I'm able to see fraction of design space plot for each individual designs and it appears in the comparison of designs (see screenshot). The corrected disallowed combinations script is here (make sure that I didn't do any mistake inversing X1/X2/X4 in the script):
X2 == 1 & (X4 >= 0.0595238095238095 & X4 <= 10) | (
X2 == 2 | X2 == 3) & X4 == 0
For your second question with the efficiency comparison of designs, keep in mind that your reference in this platform based on your screenshots is the v5 (so the smallest design with 18 runs). So JMP will calculate the relative efficiencies of v5 compared to v6 and v7 (as fractions : v5 efficiency divided by V6 or v7 efficiency for all efficiencies criteria). Based on your screenshot, you can see that v6 will be 2 times more efficient than v5 for D/G/A/I efficiencies criteria when you add 18 runs, and v7 will be 3 times more efficient than v5 for D/G/A/I efficiencies criteria when you add 36 runs (because relative efficiencies of v5 are 0,333 compared to v7).
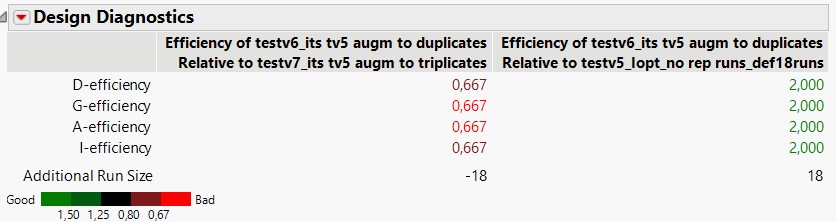
If you want to see the comparison based on your "medium" design with 36 runs, launch the Design comparison platform from the datatable of your 36 runs design. You should have the relative comparison as shown in my attached screenshot (and you'll indeed see that v6 has relative efficiencies values 2 times higher than for v5).
"It is not unusual for a well-designed experiment to analyze itself" (Box, Hunter and Hunter)

- Mark as New
- Bookmark
- Subscribe
- Mute
- Subscribe to RSS Feed
- Get Direct Link
- Report Inappropriate Content
Re: Comparing DoEs- Why D/G/A/I- efficiencies are all the SAME and terribly LOW?
The scale for the prediction variance used by the FDS plot looks wrong. I suspect all the values are greater than the maximum on the scale. Did you try to change the scale?
Power is always lower for higher-order terms. Also, power is not that important when you are not using the analysis to determine which effects are important. The prediction variance is more important when using the model to optimize factor settings.
The efficiencies are normalized for the number of runs, so replicating a design will not change the efficiency. Efficiency is not helpful as an absolute metric. It informs you about the current design relative to a theoretical design, which is often impossible. Use it as a comparative measure to compare two or more designs. So the design with efficiency = 1/2 is better than the design with efficiency = 1/3.
- Mark as New
- Bookmark
- Subscribe
- Mute
- Subscribe to RSS Feed
- Get Direct Link
- Report Inappropriate Content
Re: Comparing DoEs- Why D/G/A/I- efficiencies are all the SAME and terribly LOW?
Hi @ADouyon,
First, I just checked the JMP help section, and when using the platform "Compare designs", the explanation I gave about the efficiencies ratio is correct. See Designs of Different Run Sizes (jmp.com)
Concerning your new questions :
- Since constraints are part of the design creation (they are taken into account to know which part of the experimental space is restricted/forbidden, and the coordinate exchange algorithm try to put the points in this new space in the most optimal way), you can't change the constraints after having generated your design. Else, you may find points that are in the newly forbidden/restricted part of your experimental space, so these runs won't be feasible. I'm afraid you'll have to start over. If you're talking about the constraints and the problem I have identified with the names of the variables, you can edit the script, but please check that the variable names are correct in my edit to be sure that the design table that you already have respect the constraints.
If you click on the script "DoE Dialog", you'll see a new window opened, with all the informations you had just before clicking the "Make Design", so you'll be able to check what were the estimability of the terms in your design (see screenshot). - As this X4*X4 is not a "necessary" estimable term, you won't see it in the "Evaluate Design" platform, because the number of runs is smaller than the total number of parameters that you would like to estimate (necessary + if possible). In the JMP help about design diagnostics: "These diagnostics are not shown for designs that include factors with Changes set to Hard or Very Hard or effects with Estimability designated as If Possible." (source: Design Diagnostics (jmp.com)). That's why you have a "worse" design diagnostic when you compare this design with a design that has this term estimability set to "Necessary" (as it is taken into account in the evaluation of the design this time).
But in the analysis, this term is still kept, because if a main effect is for example not significant, this makes some degrees of freedoms free in order to estimate another effect/term. You can read more details about this specific design (with "If possible" estimable terms) here : Optimality Criteria (jmp.com) There are several ways to analyze this type of designs, I have mentioned some in another of your post : Solved: Re: Error when comparing multiple DOE designs - JMP User Community
I would suggest to keep your design with estimability of term X4*X4 set to "If possible", and try augmenting your design if the responses you have measured show a strong indication that this term may be significant, and/or if you lack precision for your predicted response(s). DoE is not necessarily a "do it all in one time" approach, it is often best to start with smaller design, and augment them in the most efficient and optimal way (sequential/iterative approach).
3. You will find your answers here : Power Analysis (jmp.com) You can freely change the response anticipated (or coefficient anticipated) values to see how anticipated coefficients behave (or inversely how response anticipated values change). Don't forget to change the intercept coefficient to have responses above 10 in your concrete case if you want to be closer to anticipated responses for your use case.
4. The optimality criterion may change depending on the way you're augmenting the design. For example if you go from a screening design to a RSM design (by adding interactions and quadratic terms in the model), then optimality criterion may change from D to I optimal. Best option is to check which one is set by JMP (you can look in the table, just below the name of the table and above scripts, which criterion was chosen and how was the design generated), or to set it if you know in advance (red triangle in Custom Design platform, optimality criterion, and then choose the most relevant one).
Hope this answer will help you,
"It is not unusual for a well-designed experiment to analyze itself" (Box, Hunter and Hunter)
- Mark as New
- Bookmark
- Subscribe
- Mute
- Subscribe to RSS Feed
- Get Direct Link
- Report Inappropriate Content
Re: Comparing DoEs- Why D/G/A/I- efficiencies are all the SAME and terribly LOW?
Yes, that is exactly what it means. This information is a consistency check if you use the Power Analysis this way. You can enter anticipated coefficients and review the expected response for each run, or you can enter the anticipated answer and review the corresponding coefficients you will get from the regression analysis. They are just two different ways of telling JMP about the size of the effects you expect to perform the power analysis. They are different, but they must be consistent.
- Mark as New
- Bookmark
- Subscribe
- Mute
- Subscribe to RSS Feed
- Get Direct Link
- Report Inappropriate Content
Re: Comparing DoEs- Why D/G/A/I- efficiencies are all the SAME and terribly LOW?
Hi @ADouyon,
Concerning your first question about your G-efficiency lower than your D-efficiency, it's quite hard to compare different efficiencies metrics only on one design. Remember that efficiencies metrics are aggregated measures/statistics of optimality criteria, so they can provide a good overview when comparing designs, but they are not sufficient to take a decision.
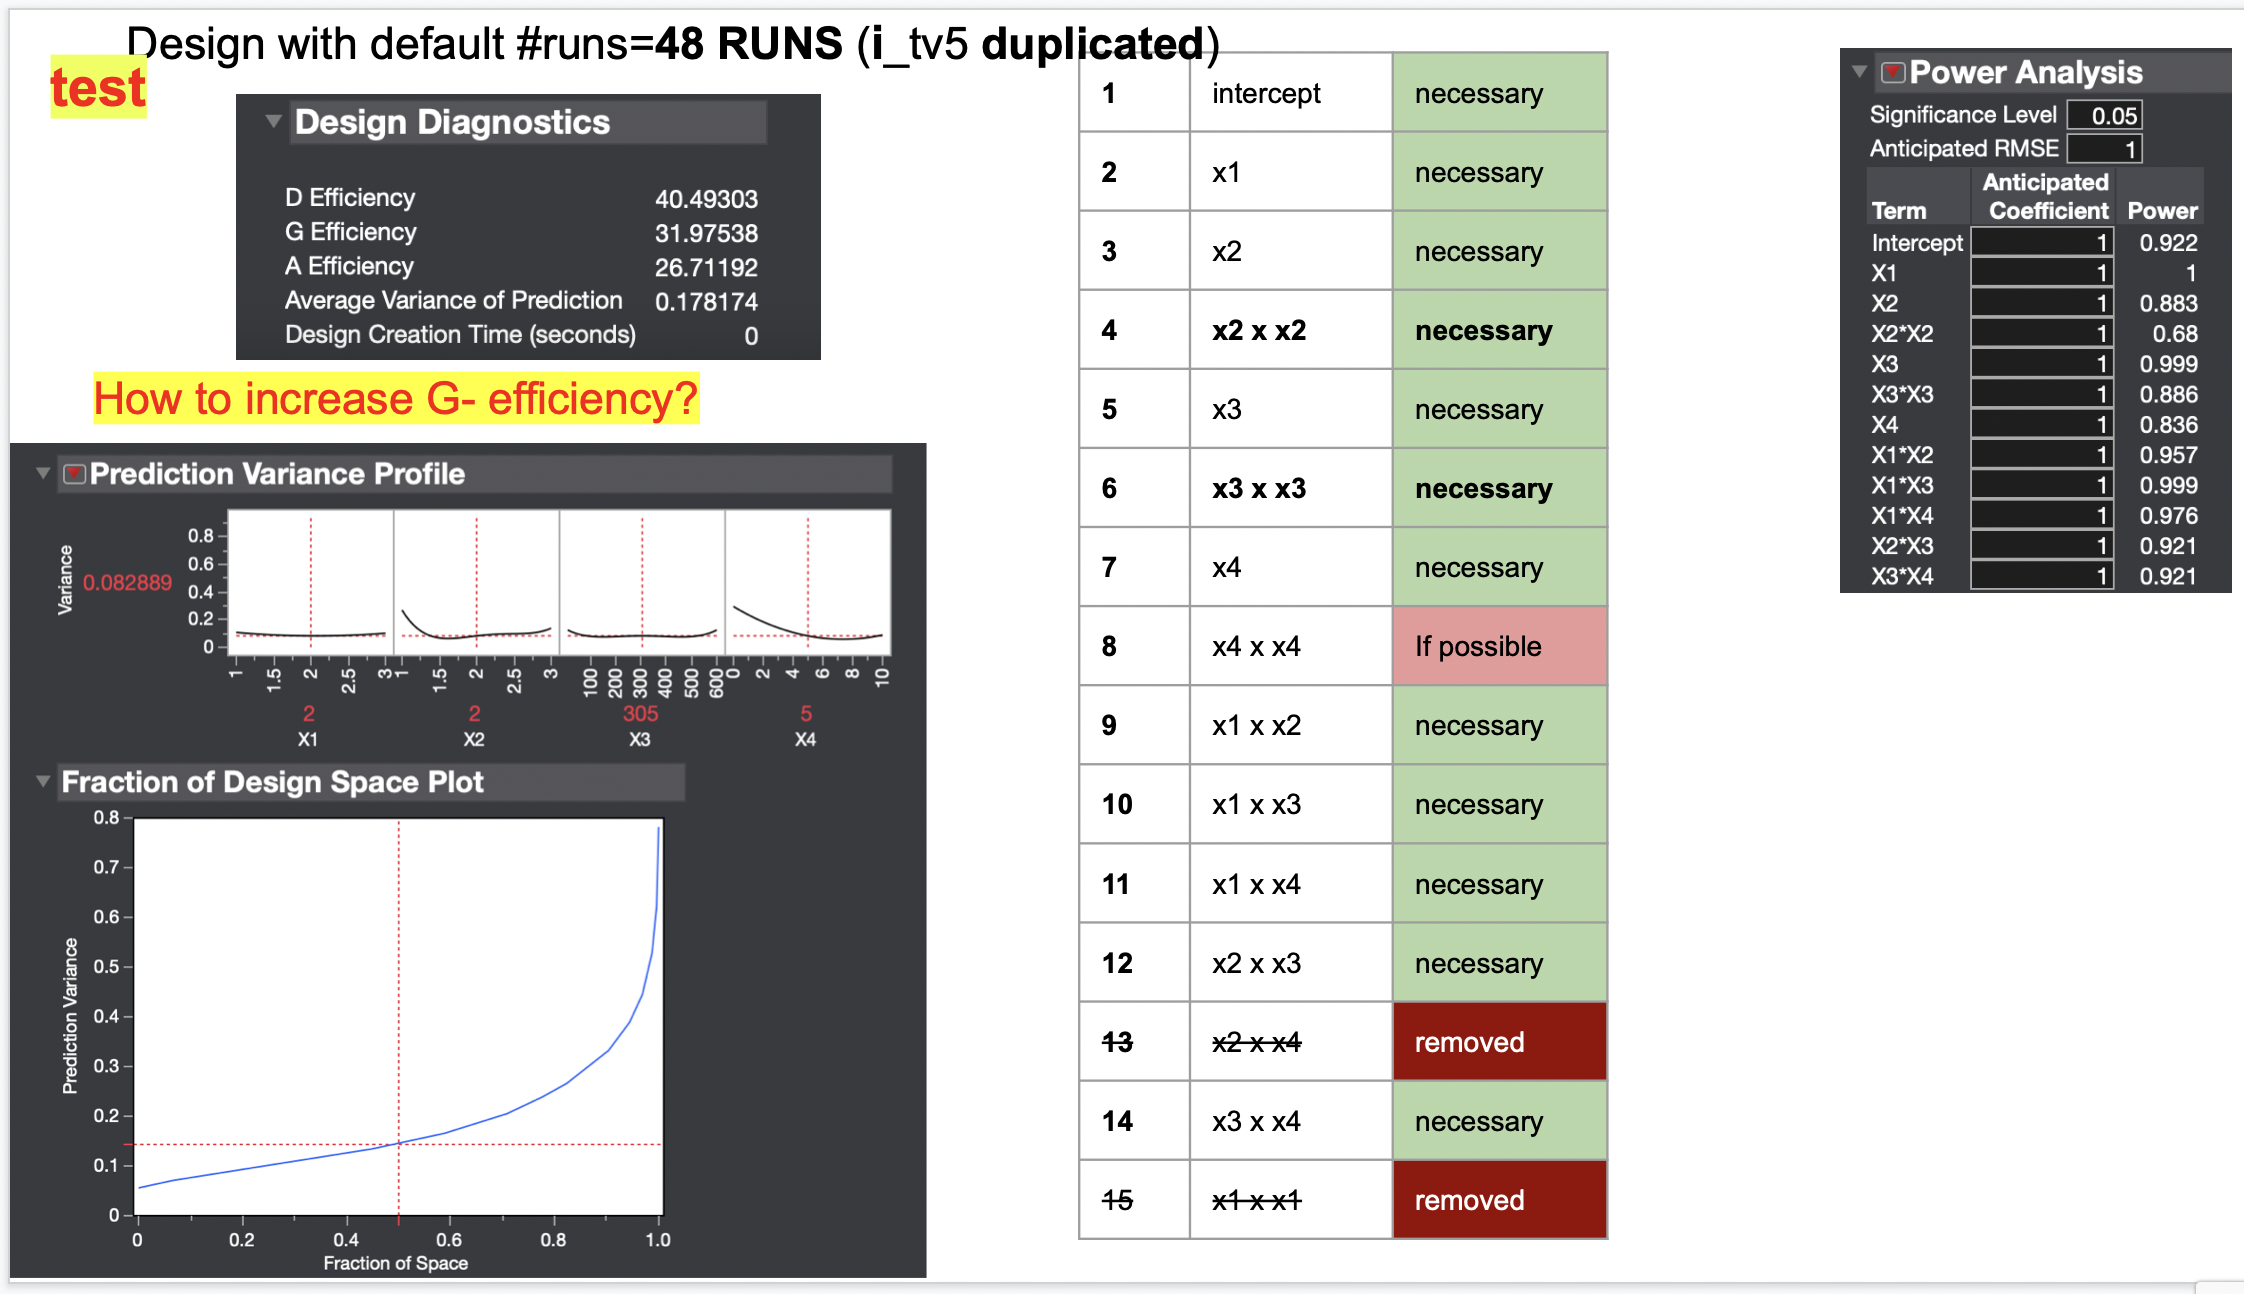
- If you are concerned about the precision of your predicted responses, I think the "Prediction Variance Profile" is much more informative, as you can explore and determine in which area of your experimental space your relative variance prediction is the highest. In your latest design, you will have a relative variance prediction quite high when X2 is at the lowest level (1) and X4 at the highest (10), which is normal because due to the disallowed combinations, no points will be in this area (see screenshot "Experimental-space-X4-X2"). This may also explain why the aggregated measure for G-optimality, G-efficiency, is low (because of the restricted experimental area, increasing the relative prediction variance).
So you can gain a good understanding visualizing your experimental points/space and looking at the "Prediction Variance profile". See Prediction Variance Profile (jmp.com) for more details and for calculating actual variance of prediction.
Concerning your second question, these anticipated response values are not a prediction of the response, because if they were, that suppose you already know what are the exact value of the coefficients in your regression model, so you probably won't do an experimental design if you knew it already.
It's more a guide/help that you may use in two different ways :
- To know, based on the model your create and the model coefficients that you can freely choose/change, which values you could expect from the experimental responses (don't forget to change the coefficient of your intercept to have response values in the range of what you would expect, and not centered around 0/1, depending on the other coefficients).
- To assess, with the help of Power column, what would be the lowest difference detectable (or the probability to detect and effect) with your design, for a specific significance level and RMSE.
I hope this response will be helpful,
"It is not unusual for a well-designed experiment to analyze itself" (Box, Hunter and Hunter)
- Mark as New
- Bookmark
- Subscribe
- Mute
- Subscribe to RSS Feed
- Get Direct Link
- Report Inappropriate Content
Re: Comparing DoEs- Why D/G/A/I- efficiencies are all the SAME and terribly LOW?
Hello @ADouyon,
There is no "hard rule" or "cut off value" on how low the (relative ?) prediction variance should be, as this requirement may differ depending on the topic, domain and business value. In some domains and specific applications (like pharmaceutical), there are norms about the required precision of the models, in some others this value is left at the discretion of the scientists/experimenters. There should be a compromise between an adequate precision according to the possible experimental budget and constraints of the design/experimental space.
I'm not suprised by the comparison and results you have between the two designs, as increasing the number of runs will decrease the prediction variance (you'll have more degrees of freedom, and consequently a better estimation of errors/noise and of effects).
If you're in a "proof of concept" phase and not entirely sure which factors to enter in your model and design, I find quite dangerous to remove a factor if you're not entirely sure that this factor has no effect on the response(s).
To stay safe, I would prefer start with a design that has an higher variance of prediction (but more factors evaluated), in order to be sure not to miss an effect. Once this screening is done (on main effects and interactions), you can always augment your design to decrease prediction variance (predictive model) and/or enter new terms in the model (like quadratic effects for optimization of the model).
Your choice will depend on which stage you're in for the design (screening, optimisation, prediction ?) and the knowledge you already have about your process/product/formulation/...
"It is not unusual for a well-designed experiment to analyze itself" (Box, Hunter and Hunter)
- Mark as New
- Bookmark
- Subscribe
- Mute
- Subscribe to RSS Feed
- Get Direct Link
- Report Inappropriate Content
Re: Comparing DoEs- Why D/G/A/I- efficiencies are all the SAME and terribly LOW?
Hello @ADouyon,
Yes, generally you don't do only one design, but you keep augmenting it several times as your knowledge of the process/system/formulation increases.
You can start by only screening main effects (depending on the number of factors and required number of runs you may add interaction terms directly in this phase), then interactions to optimize the knowledge about the system, and then quadratic effects to build a robust predictive model.
Depending on the number and type of factors, there might be better alternatives : for example, for a high number of factors (>5, and only continuous or 2-levels categorical factors), Definitive Screening Designs (DSD) might be a good choice for screening main effects in an unbiased way, and have the possibility to detect some interaction and quadratic terms.
Hope this answer will help you,
"It is not unusual for a well-designed experiment to analyze itself" (Box, Hunter and Hunter)
- Mark as New
- Bookmark
- Subscribe
- Mute
- Subscribe to RSS Feed
- Get Direct Link
- Report Inappropriate Content
Re: Comparing DoEs- Why D/G/A/I- efficiencies are all the SAME and terribly LOW?
Hi @ADouyon,
- You're right, since you add few factors to screen, I recommended you to add quadratic effect for time, since chemical or biological process are rarely linearly dependent over time, so it may be best to have this quadratic term directly in the model. And since you had "constraints" with this time factor (for decimals), you choose a discrete numeric type with 3 levels for this factor, which automatically adds the quadratic terms in the model with the estimability "if possible", so you should be ok with these settings.
- These buckets are not entirely separated from each others, it's more a help and to guide you during your DoE creation process, to self-assess at which stage you are. Depending on your experimental budget, it can be tempting to do only one big DoE, but it may be a lack of ressources, as most of the effects won't probably be significant or have a big influence on the response. This is why I tend to describe the use of DoE during a study with these 3 steps : screening, optimization and prediction, as it helps to figure out what you already know about the system, and what you would like to know to further understand and predict your system. I used in previous DoE trainings the figure I have inserted as a screenshot here. But as you say, depending on the situation it may look a bit over-simplistic and all studies using DoE don't go through these 3 stages, as previous knowledge, domain experience or historical data can help have a fair understanding of the system.
In your case, your number of factors is quite low, but you're unsure about the significance of some effects (X4 and interactions/quadratic effect involving X4). So I would choose a D-optimality criterion in order to assess parameters estimates as precisely as possible, and have the possibility to sort significant effects from non-significant ones.
Your design does make sense, and the 24-runs DoE ("i_tv5_Iopt_changedEst_remov2_24runs") done before replication looks like a good compromise between runs size and screening of effects. And due to the presence of 5 replicate runs, you should be able to estimate noise in your response and lack-of-fit.
It may not be already a predictive model (depending on the precision you want to have), but it's a first good step in assessing which terms are significant, and from there, you can augment the design to improve the prediction precision.
I hope this answer will help you,
"It is not unusual for a well-designed experiment to analyze itself" (Box, Hunter and Hunter)
- Mark as New
- Bookmark
- Subscribe
- Mute
- Subscribe to RSS Feed
- Get Direct Link
- Report Inappropriate Content
Re: Comparing DoEs- Why D/G/A/I- efficiencies are all the SAME and terribly LOW?
The prediction variance is helpful information when comparing two or more designs when prediction is the primary goal of this experiment—the lower the variance, the better the design.
Remember that there is no information about the variance of the response before the data is collected. This plot assumes that this variance is 1, which is unlikely. The plot also assumes the linear model and its assumptions, including constant variance throughout the response range. If you have an estimate of the response, then multiply the scale in this plot by your estimate to learn the actual prediction variance. The square root of this variance is the standard error of prediction.
- Mark as New
- Bookmark
- Subscribe
- Mute
- Subscribe to RSS Feed
- Get Direct Link
- Report Inappropriate Content
Re: Comparing DoEs- Why D/G/A/I- efficiencies are all the SAME and terribly LOW?
Hi @ADouyon,
Great, I think it makes more sense to first be sure about main effects and interactions, and then augment the design to optimize variance prediction.
1- If you can run your experiments by batch of 12 runs, it is safer and recommended to use blocking. In your case, a random block like you did seems a good choice, as you're not particularly interested in knowing the difference between the two runs, but more on the variability in the two runs.
2- The problem with the "Augment Design" platform is that you will probably lose your random blocking (because even if you put it in the factors before launching the platform, it won't be taken into consideration after, and you'll only have access to "Augment" option, not the "Replicate" one). Two options to be able to augment your design and replicate it :
- You just copy your first 24 rows, paste it after, and change the random block levels (1 becomes 3, 2 becomes 4).
- You directly generate a 48 runs design, by specifying in the design generation that you want 24 replicate runs, by group of 12 experiments. You'll end up with design tv8 (attached), and from there, you can directly run the 48 experiments of this design if you have enough experimental budget.
The two approaches are similar, even if the second one (tv8 compared to augmented tv7 by copy/paste) is more efficient (better repartition of experimental runs in the different blocks, see screenshots).
"It is not unusual for a well-designed experiment to analyze itself" (Box, Hunter and Hunter)
- Mark as New
- Bookmark
- Subscribe
- Mute
- Subscribe to RSS Feed
- Get Direct Link
- Report Inappropriate Content
Re: Comparing DoEs- Why D/G/A/I- efficiencies are all the SAME and terribly LOW?
Hi @ADouyon,
For your first question, the fraction of design space plot is blank for each individual design, which is weird. Looking at your disallowed combinations script, there may be a problem, as the name of your factors in the datatable are not the same in your "Disallowed combinations" script (so JMP may be lost in interpreting what is "Pulses" and which column it is for example).
When I change the "Disallowed combinations" script with anonymized names for columns (X1, X2, X3, X4), I'm able to see fraction of design space plot for each individual designs and it appears in the comparison of designs (see screenshot). The corrected disallowed combinations script is here (make sure that I didn't do any mistake inversing X1/X2/X4 in the script):
X2 == 1 & (X4 >= 0.0595238095238095 & X4 <= 10) | (
X2 == 2 | X2 == 3) & X4 == 0
For your second question with the efficiency comparison of designs, keep in mind that your reference in this platform based on your screenshots is the v5 (so the smallest design with 18 runs). So JMP will calculate the relative efficiencies of v5 compared to v6 and v7 (as fractions : v5 efficiency divided by V6 or v7 efficiency for all efficiencies criteria). Based on your screenshot, you can see that v6 will be 2 times more efficient than v5 for D/G/A/I efficiencies criteria when you add 18 runs, and v7 will be 3 times more efficient than v5 for D/G/A/I efficiencies criteria when you add 36 runs (because relative efficiencies of v5 are 0,333 compared to v7).
If you want to see the comparison based on your "medium" design with 36 runs, launch the Design comparison platform from the datatable of your 36 runs design. You should have the relative comparison as shown in my attached screenshot (and you'll indeed see that v6 has relative efficiencies values 2 times higher than for v5).
"It is not unusual for a well-designed experiment to analyze itself" (Box, Hunter and Hunter)
- Mark as New
- Bookmark
- Subscribe
- Mute
- Subscribe to RSS Feed
- Get Direct Link
- Report Inappropriate Content
Re: Comparing DoEs- Why D/G/A/I- efficiencies are all the SAME and terribly LOW?
The scale for the prediction variance used by the FDS plot looks wrong. I suspect all the values are greater than the maximum on the scale. Did you try to change the scale?
Power is always lower for higher-order terms. Also, power is not that important when you are not using the analysis to determine which effects are important. The prediction variance is more important when using the model to optimize factor settings.
The efficiencies are normalized for the number of runs, so replicating a design will not change the efficiency. Efficiency is not helpful as an absolute metric. It informs you about the current design relative to a theoretical design, which is often impossible. Use it as a comparative measure to compare two or more designs. So the design with efficiency = 1/2 is better than the design with efficiency = 1/3.
- Mark as New
- Bookmark
- Subscribe
- Mute
- Subscribe to RSS Feed
- Get Direct Link
- Report Inappropriate Content
Re: Comparing DoEs- Why D/G/A/I- efficiencies are all the SAME and terribly LOW?
Hi @Mark_Bailey,
The screenshots provided are taken from the platform "Compare designs", so the efficiencies are "already" relative, since they are computed in comparison to the "worst" design here (v5 with 18 runs).
So efficiencies of v5 vs. v6 (36 runs) are 0,5 (efficiencies v5/v6 = 0,5) which should mean that efficiencies of v6 are 2 times higher than those of v5 ?
And if the logic is right, then efficiencies of v5 vs. v7 (54 runs) being 0,333 that means efficiencies of v7 are 3 times higher than those of v5, so v7 is the best design (comparatively to others), not v6 which has relative design efficiencies equal to 0,5 compared to v5.
Or did I misunderstood something ?
"It is not unusual for a well-designed experiment to analyze itself" (Box, Hunter and Hunter)
- Mark as New
- Bookmark
- Subscribe
- Mute
- Subscribe to RSS Feed
- Get Direct Link
- Report Inappropriate Content
Re: Comparing DoEs- Why D/G/A/I- efficiencies are all the SAME and terribly LOW?
Hi @Victor_G and @Mark_Bailey! Thank you for your help! Much appreciated!
@Mark_Bailey, thank you for the insight! Similar to @Victor_G, I also wonder if this 0.5 and ~0.333 (efficiency) ratio that we see when comparing to a duplicate or triplicate design, respectively, has any meaning then?
1- Thank you @Victor_G for catching that error in the constraints! I wonder, can I actually edit the constraints after I already generated the DOE table, or do I have to start over?
On the same note, after I already generated a DOE Table, how can I check/see the ‘estimability’ of the various terms (main effects, quadratic terms, etc)?
2- I also noticed another weird thing happening with my (now updated) design (i_tv5 attached). I specified the X4*X4 term as “if possible” in the ‘estimability’ selection.
After I generate the DOE Table, when I then go and check the ‘>Model’ (on the left panel), I see all terms I included prior to generating the design. However, if I go to ‘> Evaluate Design’ (also on the left panel), I notice that the term X4*X4 disappeared. It doesn’t show there. Did JMP remove that term from the design because there aren’t enough runs to analyze that x4*x4 term (the total #runs is 24)?
If I change the estimability of this term to ‘necessary’, then the design becomes worst (attached): a) the prediction variance is higher, b) the power analysis is all 0s and c) the design efficiencies are 10x lower.
This issue with the x4*x4 term is giving me difficulties when comparing designs. I was trying to compare this design with a duplicated design (attached). The error message shows up again ☹ “Model for primary design cannot be fit by all designs. Removing inestimable model terms.”
How can I solve this? Do I just ignore this error messageif, JMP will ignore it anyways? I believe this X4*X4 term may not be significant (but not 100% sure). Due to resources limitation, I cannot do more than 24 runs.
What would you recommend if I can only do 24 runs, and at the same time I think this term may not be very significant (but never tested it before)?
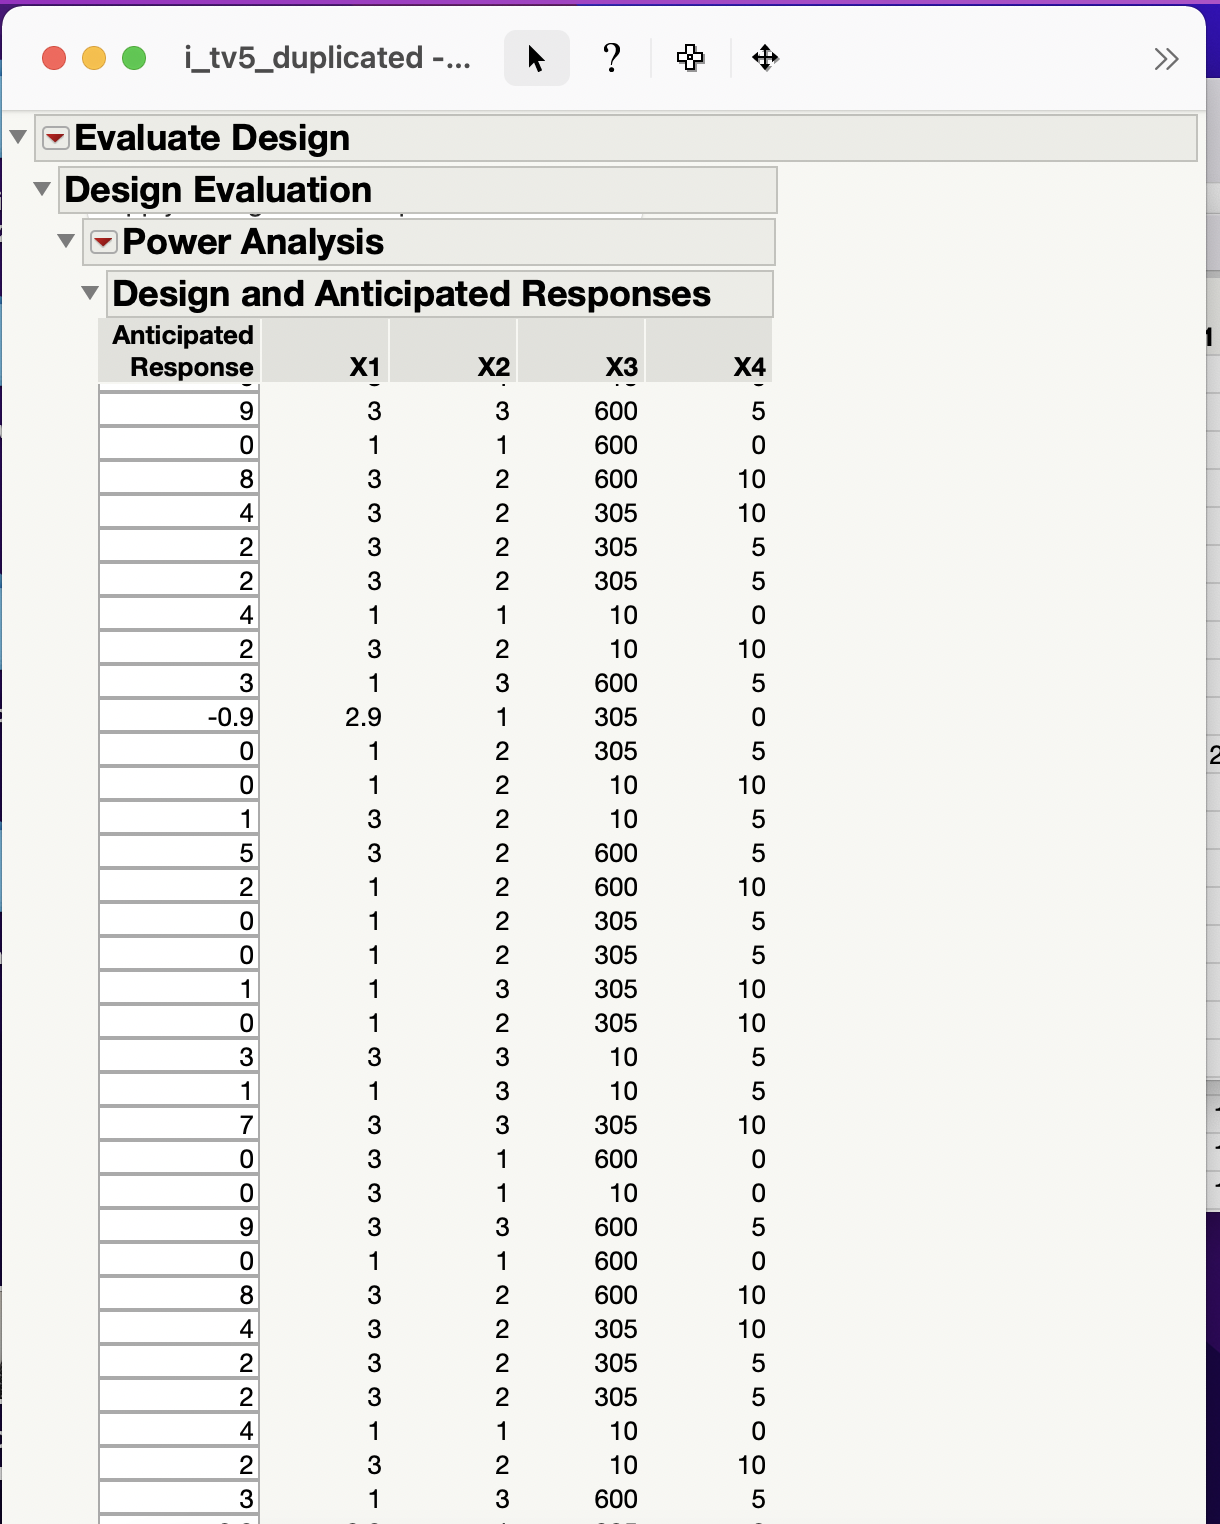
3- On the other hand; what do the values under the “Design and Anticipated Responses” (see screenshot) mean? Those values make no sense to me at all. The goal of this design is to maximize the response. I set the lower limit to 10. The values I see in this “Design and Anticipated Responses” section are <10, or 0 or some are negative values. Is this a concern?
4- One last quick question: When I augment a design, does the optimality criterion stay in the augmented design? I noticed that when I duplicate a design by augmenting it, the duplicated design seems to go back to the ‘recommended’ optimality criterion…. But, what is the recommended by JMP, is it D- or I-optimality, what is it?
Thank you all for your help!!
- Mark as New
- Bookmark
- Subscribe
- Mute
- Subscribe to RSS Feed
- Get Direct Link
- Report Inappropriate Content
Re: Comparing DoEs- Why D/G/A/I- efficiencies are all the SAME and terribly LOW?
Hi @ADouyon,
First, I just checked the JMP help section, and when using the platform "Compare designs", the explanation I gave about the efficiencies ratio is correct. See Designs of Different Run Sizes (jmp.com)
Concerning your new questions :
- Since constraints are part of the design creation (they are taken into account to know which part of the experimental space is restricted/forbidden, and the coordinate exchange algorithm try to put the points in this new space in the most optimal way), you can't change the constraints after having generated your design. Else, you may find points that are in the newly forbidden/restricted part of your experimental space, so these runs won't be feasible. I'm afraid you'll have to start over. If you're talking about the constraints and the problem I have identified with the names of the variables, you can edit the script, but please check that the variable names are correct in my edit to be sure that the design table that you already have respect the constraints.
If you click on the script "DoE Dialog", you'll see a new window opened, with all the informations you had just before clicking the "Make Design", so you'll be able to check what were the estimability of the terms in your design (see screenshot). - As this X4*X4 is not a "necessary" estimable term, you won't see it in the "Evaluate Design" platform, because the number of runs is smaller than the total number of parameters that you would like to estimate (necessary + if possible). In the JMP help about design diagnostics: "These diagnostics are not shown for designs that include factors with Changes set to Hard or Very Hard or effects with Estimability designated as If Possible." (source: Design Diagnostics (jmp.com)). That's why you have a "worse" design diagnostic when you compare this design with a design that has this term estimability set to "Necessary" (as it is taken into account in the evaluation of the design this time).
But in the analysis, this term is still kept, because if a main effect is for example not significant, this makes some degrees of freedoms free in order to estimate another effect/term. You can read more details about this specific design (with "If possible" estimable terms) here : Optimality Criteria (jmp.com) There are several ways to analyze this type of designs, I have mentioned some in another of your post : Solved: Re: Error when comparing multiple DOE designs - JMP User Community
I would suggest to keep your design with estimability of term X4*X4 set to "If possible", and try augmenting your design if the responses you have measured show a strong indication that this term may be significant, and/or if you lack precision for your predicted response(s). DoE is not necessarily a "do it all in one time" approach, it is often best to start with smaller design, and augment them in the most efficient and optimal way (sequential/iterative approach).
3. You will find your answers here : Power Analysis (jmp.com) You can freely change the response anticipated (or coefficient anticipated) values to see how anticipated coefficients behave (or inversely how response anticipated values change). Don't forget to change the intercept coefficient to have responses above 10 in your concrete case if you want to be closer to anticipated responses for your use case.
4. The optimality criterion may change depending on the way you're augmenting the design. For example if you go from a screening design to a RSM design (by adding interactions and quadratic terms in the model), then optimality criterion may change from D to I optimal. Best option is to check which one is set by JMP (you can look in the table, just below the name of the table and above scripts, which criterion was chosen and how was the design generated), or to set it if you know in advance (red triangle in Custom Design platform, optimality criterion, and then choose the most relevant one).
Hope this answer will help you,
"It is not unusual for a well-designed experiment to analyze itself" (Box, Hunter and Hunter)
- Mark as New
- Bookmark
- Subscribe
- Mute
- Subscribe to RSS Feed
- Get Direct Link
- Report Inappropriate Content
Re: Comparing DoEs- Why D/G/A/I- efficiencies are all the SAME and terribly LOW?
Hi @Victor_G, thank you very much for taking the time to explain everything and for pointing me to additional resources! It's very helpful!
I was wondering, is the fact that the G-efficiency (32) is lower than the D-efficiency (41) a concern if my goal is to optimize and accurately predict the optimal response (not screen for factors)?
Also, I read the JMP help page on "Design and Anticipated Responses Outline". It specifically says "The Design and Anticipated Responses outline shows the design preceded by an Anticipated Response column. Each entry in the first column is the Anticipated Response corresponding to the design settings. The Anticipated Response is calculated using the Anticipated Coefficients...The Anticipated Response is the response value obtained using the Anticipated Coefficient values as coefficients in the model. When the outline first appears, the calculation of Anticipated Response values is based on the default values in the Anticipated Coefficient column. When you set new values in the Anticipated Response column, click Apply Changes to Anticipated Responses to update the Anticipated Coefficient and Power columns".
However, I am still a bit confused as the explanation is quite brief. These anticipated response values are not a prediction of the response, right? These values don't mean that these response values are what I should expect after doing the experiments in the lab, do they?
These values currently range from -0.9 to 9 in my i_tv5 duplicated design (attached), but this doesn't mean that I should expect to obtain a response within this -0.9-9 range after I do the experiment in the lab, does it?
Thank you @Victor_G !!
- Mark as New
- Bookmark
- Subscribe
- Mute
- Subscribe to RSS Feed
- Get Direct Link
- Report Inappropriate Content
Re: Comparing DoEs- Why D/G/A/I- efficiencies are all the SAME and terribly LOW?
Yes, that is exactly what it means. This information is a consistency check if you use the Power Analysis this way. You can enter anticipated coefficients and review the expected response for each run, or you can enter the anticipated answer and review the corresponding coefficients you will get from the regression analysis. They are just two different ways of telling JMP about the size of the effects you expect to perform the power analysis. They are different, but they must be consistent.
- Mark as New
- Bookmark
- Subscribe
- Mute
- Subscribe to RSS Feed
- Get Direct Link
- Report Inappropriate Content
Re: Comparing DoEs- Why D/G/A/I- efficiencies are all the SAME and terribly LOW?
Thank you @Mark_Bailey for clarifying!
That makes sense!
So, right now the anticipated coefficients by default are all 1. Because all coefficients are the same value (=1), the anticipated responses are very similar between the various treatments/runs (ranging from -0.9 to 9). Right? However, in real life these values will probably not all be the same and also probably these values will not be equal to 1. Did I understand this correctly?
Thank you very much!!
- Mark as New
- Bookmark
- Subscribe
- Mute
- Subscribe to RSS Feed
- Get Direct Link
- Report Inappropriate Content
Re: Comparing DoEs- Why D/G/A/I- efficiencies are all the SAME and terribly LOW?
As such, the default values of 1 for the RMSE and all coefficients are useful. This setup reflects the case where you expect the absolute value of all the effects to be at least twice the RMSE It is a relative comparison.
Recommended Articles
- © 2026 JMP Statistical Discovery LLC. All Rights Reserved.
- Terms of Use
- Privacy Statement
- Contact Us