- Don’t miss your chance to experience Discovery Summit Europe at our best available rate! Early bird registration through 31 Oct.
- Graph Builder Toolbar streamlines interactive graphing. Creates shortcuts on Report and GraphBuilder Helpers toolbars. Download and install the extension.
- Subscribe to RSS Feed
- Mark Topic as New
- Mark Topic as Read
- Float this Topic for Current User
- Bookmark
- Subscribe
- Mute
- Printer Friendly Page
Discussions
Solve problems, and share tips and tricks with other JMP users.- User Community
- :
- Discussions
- :
- Re: Changing the color of clusters?

- Mark as New
- Bookmark
- Subscribe
- Mute
- Subscribe to RSS Feed
- Get Direct Link
- Report Inappropriate Content
Changing the color of clusters?
Hello everybody!
I want to do a simple thing. After the creation of a 3D Cluster Plot (k-means clustering), I want to change the color of the received clusters. It is no problem to change the symbol, but even if I change the color of the symbol in the data table and redo the analysis, nothing happen.
Would be great, if someone can help me with a suggestion!
Greetings!
/Marco
Accepted Solutions


- Mark as New
- Bookmark
- Subscribe
- Mute
- Subscribe to RSS Feed
- Get Direct Link
- Report Inappropriate Content
Re: Changing the color of clusters?
Okay...One last effort
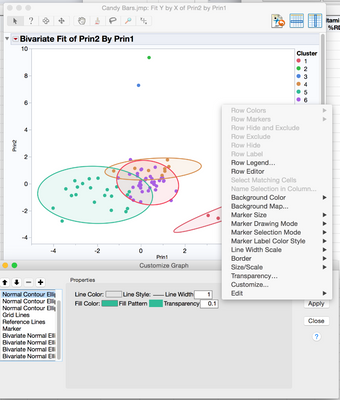
I saved off the Principal Components from the Multivariate platform since the output that you shared originated in the Biplot display after the K-Means Clustering. I then plotted the P2 vs. P1 in the Fit Y by X platform and customized the view there. The cluster color can be customized there.
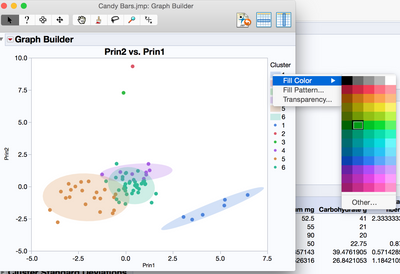
Or using Graph Builder I could get this view with editable ellipse colors
- Mark as New
- Bookmark
- Subscribe
- Mute
- Subscribe to RSS Feed
- Get Direct Link
- Report Inappropriate Content
Re: Changing the color of clusters?
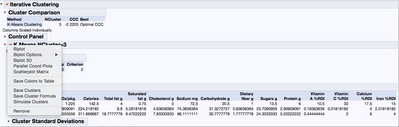
Have you tried red triangle>Save Colors to Table
- Mark as New
- Bookmark
- Subscribe
- Mute
- Subscribe to RSS Feed
- Get Direct Link
- Report Inappropriate Content
Re: Changing the color of clusters?
Thanks for the reply, but yes I have. By doing that, the only thing what happen is that the color of my data points in my reference table change to the color of the clusters. But I want to change the color of the clusters itself.
- Mark as New
- Bookmark
- Subscribe
- Mute
- Subscribe to RSS Feed
- Get Direct Link
- Report Inappropriate Content
Re: Changing the color of clusters?
Okay....If I open Candy Bars.jmp from the Help>Sample Data...
Run Analyze>Multivariate Methods>Cluster>K-Means, choose 6 clusters ...Go
Red triangle>Save Clusters....
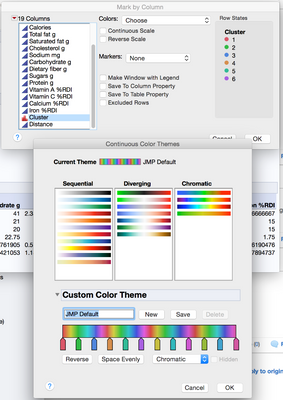
Then Row>Color or Mark by Columns....select Cluster column.
When you get to the next screen you will be able to change the color of the clusters.
- Mark as New
- Bookmark
- Subscribe
- Mute
- Subscribe to RSS Feed
- Get Direct Link
- Report Inappropriate Content
Re: Changing the color of clusters?
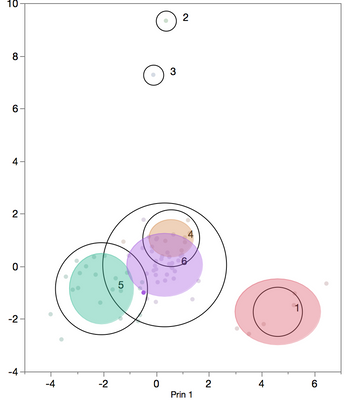
Thanks again, for your fast answer. Unfortunately your idea does not solve my problem, that is the same thing than before. This process does only change the colors in the data table but not the color of the "cluster bubble graph". I want to change for example the bubble from cluster 1 from red to green in this plot and not the color of the dots. Maybe with the picture my question is a bit clearer .
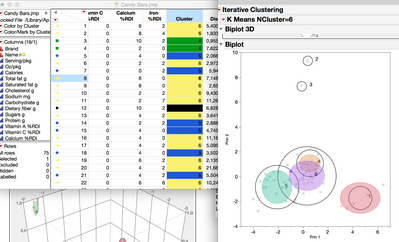
By doing the steps you have suggested the results are pictured below. You can easily see, that only the shape of the data points has changed but not the color of the clusters...
- Mark as New
- Bookmark
- Subscribe
- Mute
- Subscribe to RSS Feed
- Get Direct Link
- Report Inappropriate Content
Re: Changing the color of clusters?
Okay...One last effort
I saved off the Principal Components from the Multivariate platform since the output that you shared originated in the Biplot display after the K-Means Clustering. I then plotted the P2 vs. P1 in the Fit Y by X platform and customized the view there. The cluster color can be customized there.
Or using Graph Builder I could get this view with editable ellipse colors
- Mark as New
- Bookmark
- Subscribe
- Mute
- Subscribe to RSS Feed
- Get Direct Link
- Report Inappropriate Content
Re: Changing the color of clusters?
Ok, that works even with the 3D Plot. Thanks for the solution!
But to be honest, is there not a simpler way to do that, instead of doing a whole new PCA to extract the PC's only to change the color of the clusters??? I really miss a change color button in the red triangle of the clusters result overview, possible with the dots but not with the ellipses, thats a bit strange...
Recommended Articles
- © 2026 JMP Statistical Discovery LLC. All Rights Reserved.
- Terms of Use
- Privacy Statement
- Contact Us