- Don’t miss your chance to experience Discovery Summit Europe at our best available rate! Early bird registration through 31 Oct.
- Image to Table JMP extension imports single or batch images as data tables. Useful to extract curves from pictures or convert image data to curve data to use in analyses like Functional Data Explorer. Download and install the extension.
- Subscribe to RSS Feed
- Mark Topic as New
- Mark Topic as Read
- Float this Topic for Current User
- Bookmark
- Subscribe
- Mute
- Printer Friendly Page
Discussions
Solve problems, and share tips and tricks with other JMP users.- User Community
- :
- Discussions
- :
- Change the "values" JMP uses for evaluation of the "warning tests" (violation ru...

- Mark as New
- Bookmark
- Subscribe
- Mute
- Subscribe to RSS Feed
- Get Direct Link
- Report Inappropriate Content
Change the "values" JMP uses for evaluation of the "warning tests" (violation rules).
Hello there!
So I am using JMP software to add the first three violation rules for my automated control charts - which is fairly easy to enable (manually or scripting, shown here in the manual option):
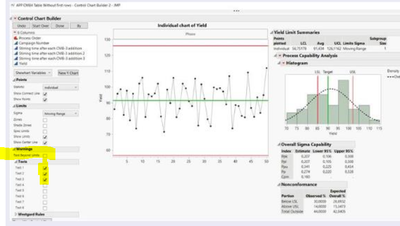
However, JMP evaluates the warning rules to the control limits JMP has calculated (UCL/Avg/LCL as shown in the limit summary above). I would like for JMP to evaluate the warning rules to our internal "control limits" (which have been optimised by our R&D department.. in this case that is UCL 102, demand value (instead of Avg) 90 and LCL 85).
Is there any way to do this?
Maybe by overwriting the UCL/Avg/LCL values (for each parameter, I'm running an automated script to assess x-amount of parameters by means of a for-loop, so per iteration I need to overwrite it).
I've seen a video where they change the preference of the warnings, but still using x-times the sigma values.. And that's also not good because I would like to set the limits for each parameter + UCL/LCL aren't necessarily equally as far from the "avg" value.
Thanks for your help!
Kind regards
Jonas
Accepted Solutions


- Mark as New
- Bookmark
- Subscribe
- Mute
- Subscribe to RSS Feed
- Get Direct Link
- Report Inappropriate Content
Re: Change the "values" JMP uses for evaluation of the "warning tests" (violation rules).
If you right-click inside the graph, you can select Limits->Set Control Limits. This will allow you to set your own limits rather than using JMP's calculated limits. You can also use the set control limits command via JSL (take a look at the Object Scripting Index for an example).
- Mark as New
- Bookmark
- Subscribe
- Mute
- Subscribe to RSS Feed
- Get Direct Link
- Report Inappropriate Content
Re: Change the "values" JMP uses for evaluation of the "warning tests" (violation rules).
"Chart Col( :Delay,XBar( Avg( X), UCL( Y),LCL( X) ),R),"
with X, Y and Z my internal values.
- Mark as New
- Bookmark
- Subscribe
- Mute
- Subscribe to RSS Feed
- Get Direct Link
- Report Inappropriate Content
Re: Change the "values" JMP uses for evaluation of the "warning tests" (violation rules).
If you right-click inside the graph, you can select Limits->Set Control Limits. This will allow you to set your own limits rather than using JMP's calculated limits. You can also use the set control limits command via JSL (take a look at the Object Scripting Index for an example).
Recommended Articles
- © 2026 JMP Statistical Discovery LLC. All Rights Reserved.
- Terms of Use
- Privacy Statement
- Contact Us