JMP Security Notice: CVE-2026-109618 and CVE-2026-109619
JMP promptly initiated a review of its products, services, and relevant infrastructure for exposure to CVE-2026-109618 and CVE-2026-109619.
Our assessment of JMP products has not identified exposure to these vulnerabilities. Where remediation was required within supporting environments, appropriate security updates and controls have been applied and validated.
We have identified no evidence of successful exploitation or unauthorized access to JMP systems or customer information associated with these vulnerabilities.
JMP continues to monitor the issue and relevant vendor guidance. No action is required by JMP customers at this time.
- Don’t miss your chance to experience Discovery Summit Europe at our best available rate! Early bird registration through 31 Oct.
- Graph Builder Toolbar streamlines interactive graphing. Creates shortcuts on Report and GraphBuilder Helpers toolbars. Download and install the extension.
- Subscribe to RSS Feed
- Mark Topic as New
- Mark Topic as Read
- Float this Topic for Current User
- Bookmark
- Subscribe
- Mute
- Printer Friendly Page
Discussions
Solve problems, and share tips and tricks with other JMP users.- User Community
- :
- Discussions
- :
- Can the vertical dividing line of the X-axis in the drawing only show part of it...

- Mark as New
- Bookmark
- Subscribe
- Mute
- Subscribe to RSS Feed
- Get Direct Link
- Report Inappropriate Content
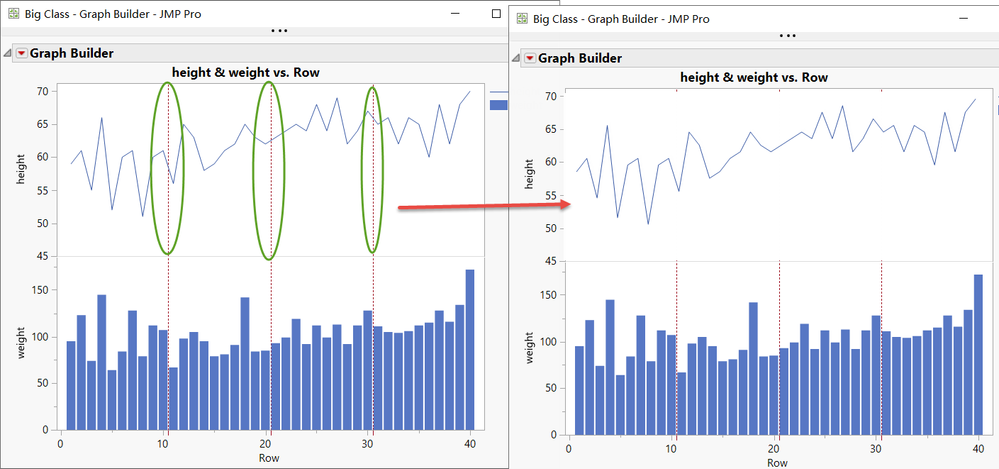
Can the vertical dividing line of the X-axis in the drawing only show part of it?
Thanks Experts!
dt=Open("$SAMPLE_DATA/Big Class.jmp");
p1=dt<< Graph Builder(
	Size( 534, 455 ),
	Show Control Panel( 0 ),
	Variables(
		X( Transform Column( "Row", Formula( Row() ) ) ),
		Y( :height ),
		Y( :weight )
	),
	Elements( Position( 1, 1 ), Line( X, Y, Legend( 5 ) ) ),
	Elements( Position( 1, 2 ), Bar( X, Y, Legend( 7 ) ) ),
	SendToReport(
		Dispatch(
			{},
			"Row",
			ScaleBox,
			{Add Ref Line( 10.5, "Dotted", "Dark Red", "", 1 ),
			Add Ref Line( 20.5, "Dotted", "Dark Red", "", 1 ),
			Add Ref Line( 30.5, "Dotted", "Dark Red", "", 1 )}
		)
	)
);
Accepted Solutions


- Mark as New
- Bookmark
- Subscribe
- Mute
- Subscribe to RSS Feed
- Get Direct Link
- Report Inappropriate Content
Re: Can the vertical dividing line of the X-axis in the drawing only show part of it?
I would suggest utilizing X/Y Origin() and X/Y Range() in cases like this
Names Default To Here(1);

dt = Open("$SAMPLE_DATA/Big Class.jmp");

dt << new column("R", Numeric, Continuous, Formula(Row()));

ar4 = [12.5, 22.5, 33.5];

gb = dt << Graph Builder(
	Size(534, 456),
	Show Control Panel(0),
	Variables(X(:R), Y(:height), Y(:weight)),
	Elements(Position(1, 1), Line(X, Y, Legend(11))),
	Elements(Position(1, 2), Bar(X, Y, Legend(14)))
);

Eval(EvalExpr(
	Report(gb)[FrameBox(2)] << Add Graphics Script(
		For Each({v}, Expr(ar4),
			Pen Color("red");
			Line Style("dashed");
			Line({v, Y Origin()}, {v, Y Origin() + Y Range()});
		);
	)
));
- Mark as New
- Bookmark
- Subscribe
- Mute
- Subscribe to RSS Feed
- Get Direct Link
- Report Inappropriate Content
Re: Can the vertical dividing line of the X-axis in the drawing only show part of it?
I would use
<< Add Graphics Script()
and use the JMP Graphic Primitives' to draw the lines you need
- Mark as New
- Bookmark
- Subscribe
- Mute
- Subscribe to RSS Feed
- Get Direct Link
- Report Inappropriate Content
Re: Can the vertical dividing line of the X-axis in the drawing only show part of it?
Thank you very much!I want to know how to implement it with a script?I would like to receive your help
Thank Jim!

- Mark as New
- Bookmark
- Subscribe
- Mute
- Subscribe to RSS Feed
- Get Direct Link
- Report Inappropriate Content
Re: Can the vertical dividing line of the X-axis in the drawing only show part of it?

- Mark as New
- Bookmark
- Subscribe
- Mute
- Subscribe to RSS Feed
- Get Direct Link
- Report Inappropriate Content
Re: Can the vertical dividing line of the X-axis in the drawing only show part of it?

- Mark as New
- Bookmark
- Subscribe
- Mute
- Subscribe to RSS Feed
- Get Direct Link
- Report Inappropriate Content
Re: Can the vertical dividing line of the X-axis in the drawing only show part of it?
Maybe better: invert the problem:
put a huge white rectangle into the plots where you DON'T want the lines - and move this layer on top of the lines.
This gives you the flexibility to adjust the lines via the GUI.
- Mark as New
- Bookmark
- Subscribe
- Mute
- Subscribe to RSS Feed
- Get Direct Link
- Report Inappropriate Content
Re: Can the vertical dividing line of the X-axis in the drawing only show part of it?

AI I only use grok3、
Using other ais to complete JSL is basically a waste of time.
dt = Open("$SAMPLE_DATA/Big Class.jmp");ca="row";New Column(ca);Column(ca)<<Formula( row() );dt<<run formulas;Column(ca)<<deleteFormula;
ar4 = [12.5, 22.5, 33.5];
p1=dt<< Graph Builder(
	Size(534, 456),
	Show Control Panel(0),
	Variables(X(:row), Y(:height), Y(:weight)),
	Elements(Position(1, 1), Line(X, Y, Legend(11))),
	Elements(Position(1, 2), Bar(X, Y, Legend(14))),
	SendToReport(
		Dispatch({}, "Graph Builder", FrameBox(2),
			{Reference Line Order(3),
			Add Graphics Script(
				2,
				Description(""),
				PenColor("red");
				LineStyle("dashed");
				ForEach({ref_line}, ar4, Line({ref_line, 0}, {ref_line, 160}));
			)}
		)
	)
);
- Mark as New
- Bookmark
- Subscribe
- Mute
- Subscribe to RSS Feed
- Get Direct Link
- Report Inappropriate Content
Re: Can the vertical dividing line of the X-axis in the drawing only show part of it?

harsh statement.
I have the feeling that every second day there is a another breakthrough and old findings have to be revised.
- Mark as New
- Bookmark
- Subscribe
- Mute
- Subscribe to RSS Feed
- Get Direct Link
- Report Inappropriate Content
Re: Can the vertical dividing line of the X-axis in the drawing only show part of it?
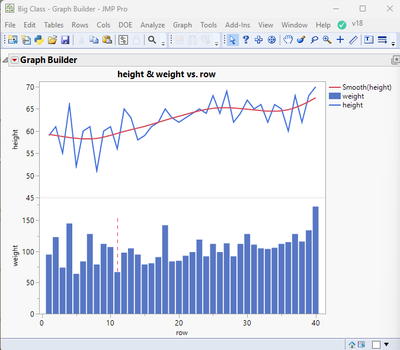
Names Default To Here( 1 );
dt =
// Open Data Table: Big Class.jmp
// → Data Table( "Big Class" )
Open( "$SAMPLE_DATA/Big Class.jmp" );
// New column: Column 6
Data Table( "Big Class" ) << New Column( "Column 6",
	Numeric,
	"Continuous",
	Format( "Best", 12 )
);


// Change column name: Column 6 → row
Data Table( "Big Class" ):Column 6 << Set Name( "row" );


// Change column formula: row
Data Table( "Big Class" ):row << Set Formula( Row() );
Graph Builder(
	Size( 534, 456 ),
	Show Control Panel( 0 ),
	Variables( X( :row ), Y( :height ), Y( :weight ) ),
	Elements(
		Position( 1, 1 ),
		Line( X, Y, Legend( 11 ) ),
		Smoother( X, Y, Legend( 10 ) )
	),
	Elements( Position( 1, 2 ), Bar( X, Y, Legend( 5 ) ) ),
	SendToReport(
		Dispatch( {}, "Graph Builder", FrameBox( 2 ),
			{Add Graphics Script(
				2,
				Description( "" ),
				Pen Color( "red" ):line style( "dashed" );
				Line( {11, 0}, {11, 160} );
			)}
		),
		Dispatch( {}, "400", LegendBox,
			{Legend Position( {11, [2], 10, [0], 5, [1]} )}
		)
	)
);- Mark as New
- Bookmark
- Subscribe
- Mute
- Subscribe to RSS Feed
- Get Direct Link
- Report Inappropriate Content
Re: Can the vertical dividing line of the X-axis in the drawing only show part of it?
Thank Jim!
dt = Open("$SAMPLE_DATA/Big Class.jmp");ca="row";New Column(ca);Column(ca)<<Formula( row() );dt<<run formulas;Column(ca)<<deleteFormula;
p1 = dt << Graph Builder(
	Size(572, 501),
	Variables(X(:row), Y(:height), Y(:weight)),
	Elements(Position(1, 1), Line(X, Y, Legend(11))),
	Elements(Position(1, 2), Bar(X, Y, Legend(14))),
	SendToReport(
		Dispatch({}, "Graph Builder", FrameBox(2),
			{Reference Line Order(3),
			Add Graphics Script(
				2,
				Description(""),
				PenColor("red");
				LineStyle("dashed");
				Line({10.5, 0}, {10.5, 160});
				Line({20.5, 0}, {20.5, 160});
				Line({30.5, 0}, {30.5, 160});
			)}
		)
	)
);Recommended Articles
- © 2026 JMP Statistical Discovery LLC. All Rights Reserved.
- Terms of Use
- Privacy Statement
- Contact Us