- Learn how to build custom Python data connectors and further customize JMP’s Data Connector Framework with the Python Data Connector Demo, available now in the JMP Marketplace!
- See how to use Accelerated Life Testing (ALT) to evaluate reliability. Register for June 5 webinar, 2pm US Eastern Time.
- Subscribe to RSS Feed
- Mark Topic as New
- Mark Topic as Read
- Float this Topic for Current User
- Bookmark
- Subscribe
- Mute
- Printer Friendly Page
Discussions
Solve problems, and share tips and tricks with other JMP users.- JMP User Community
- :
- Discussions
- :
- Calculation of t-distribution, JMP 13

- Mark as New
- Bookmark
- Subscribe
- Mute
- Subscribe to RSS Feed
- Get Direct Link
- Report Inappropriate Content
Calculation of t-distribution, JMP 13
Hello,
I would like to knwo, how the t-distribution is calculated in the programm. The results I got from the programs are different with the results I calculated by myself, with the help of methods, mentioned in various books and scientific researches.
In addition I would like to know, how it is possible to set up an own quantil in the t-distribution. When I make a box plot, I just can change it in the standard normal distribution.
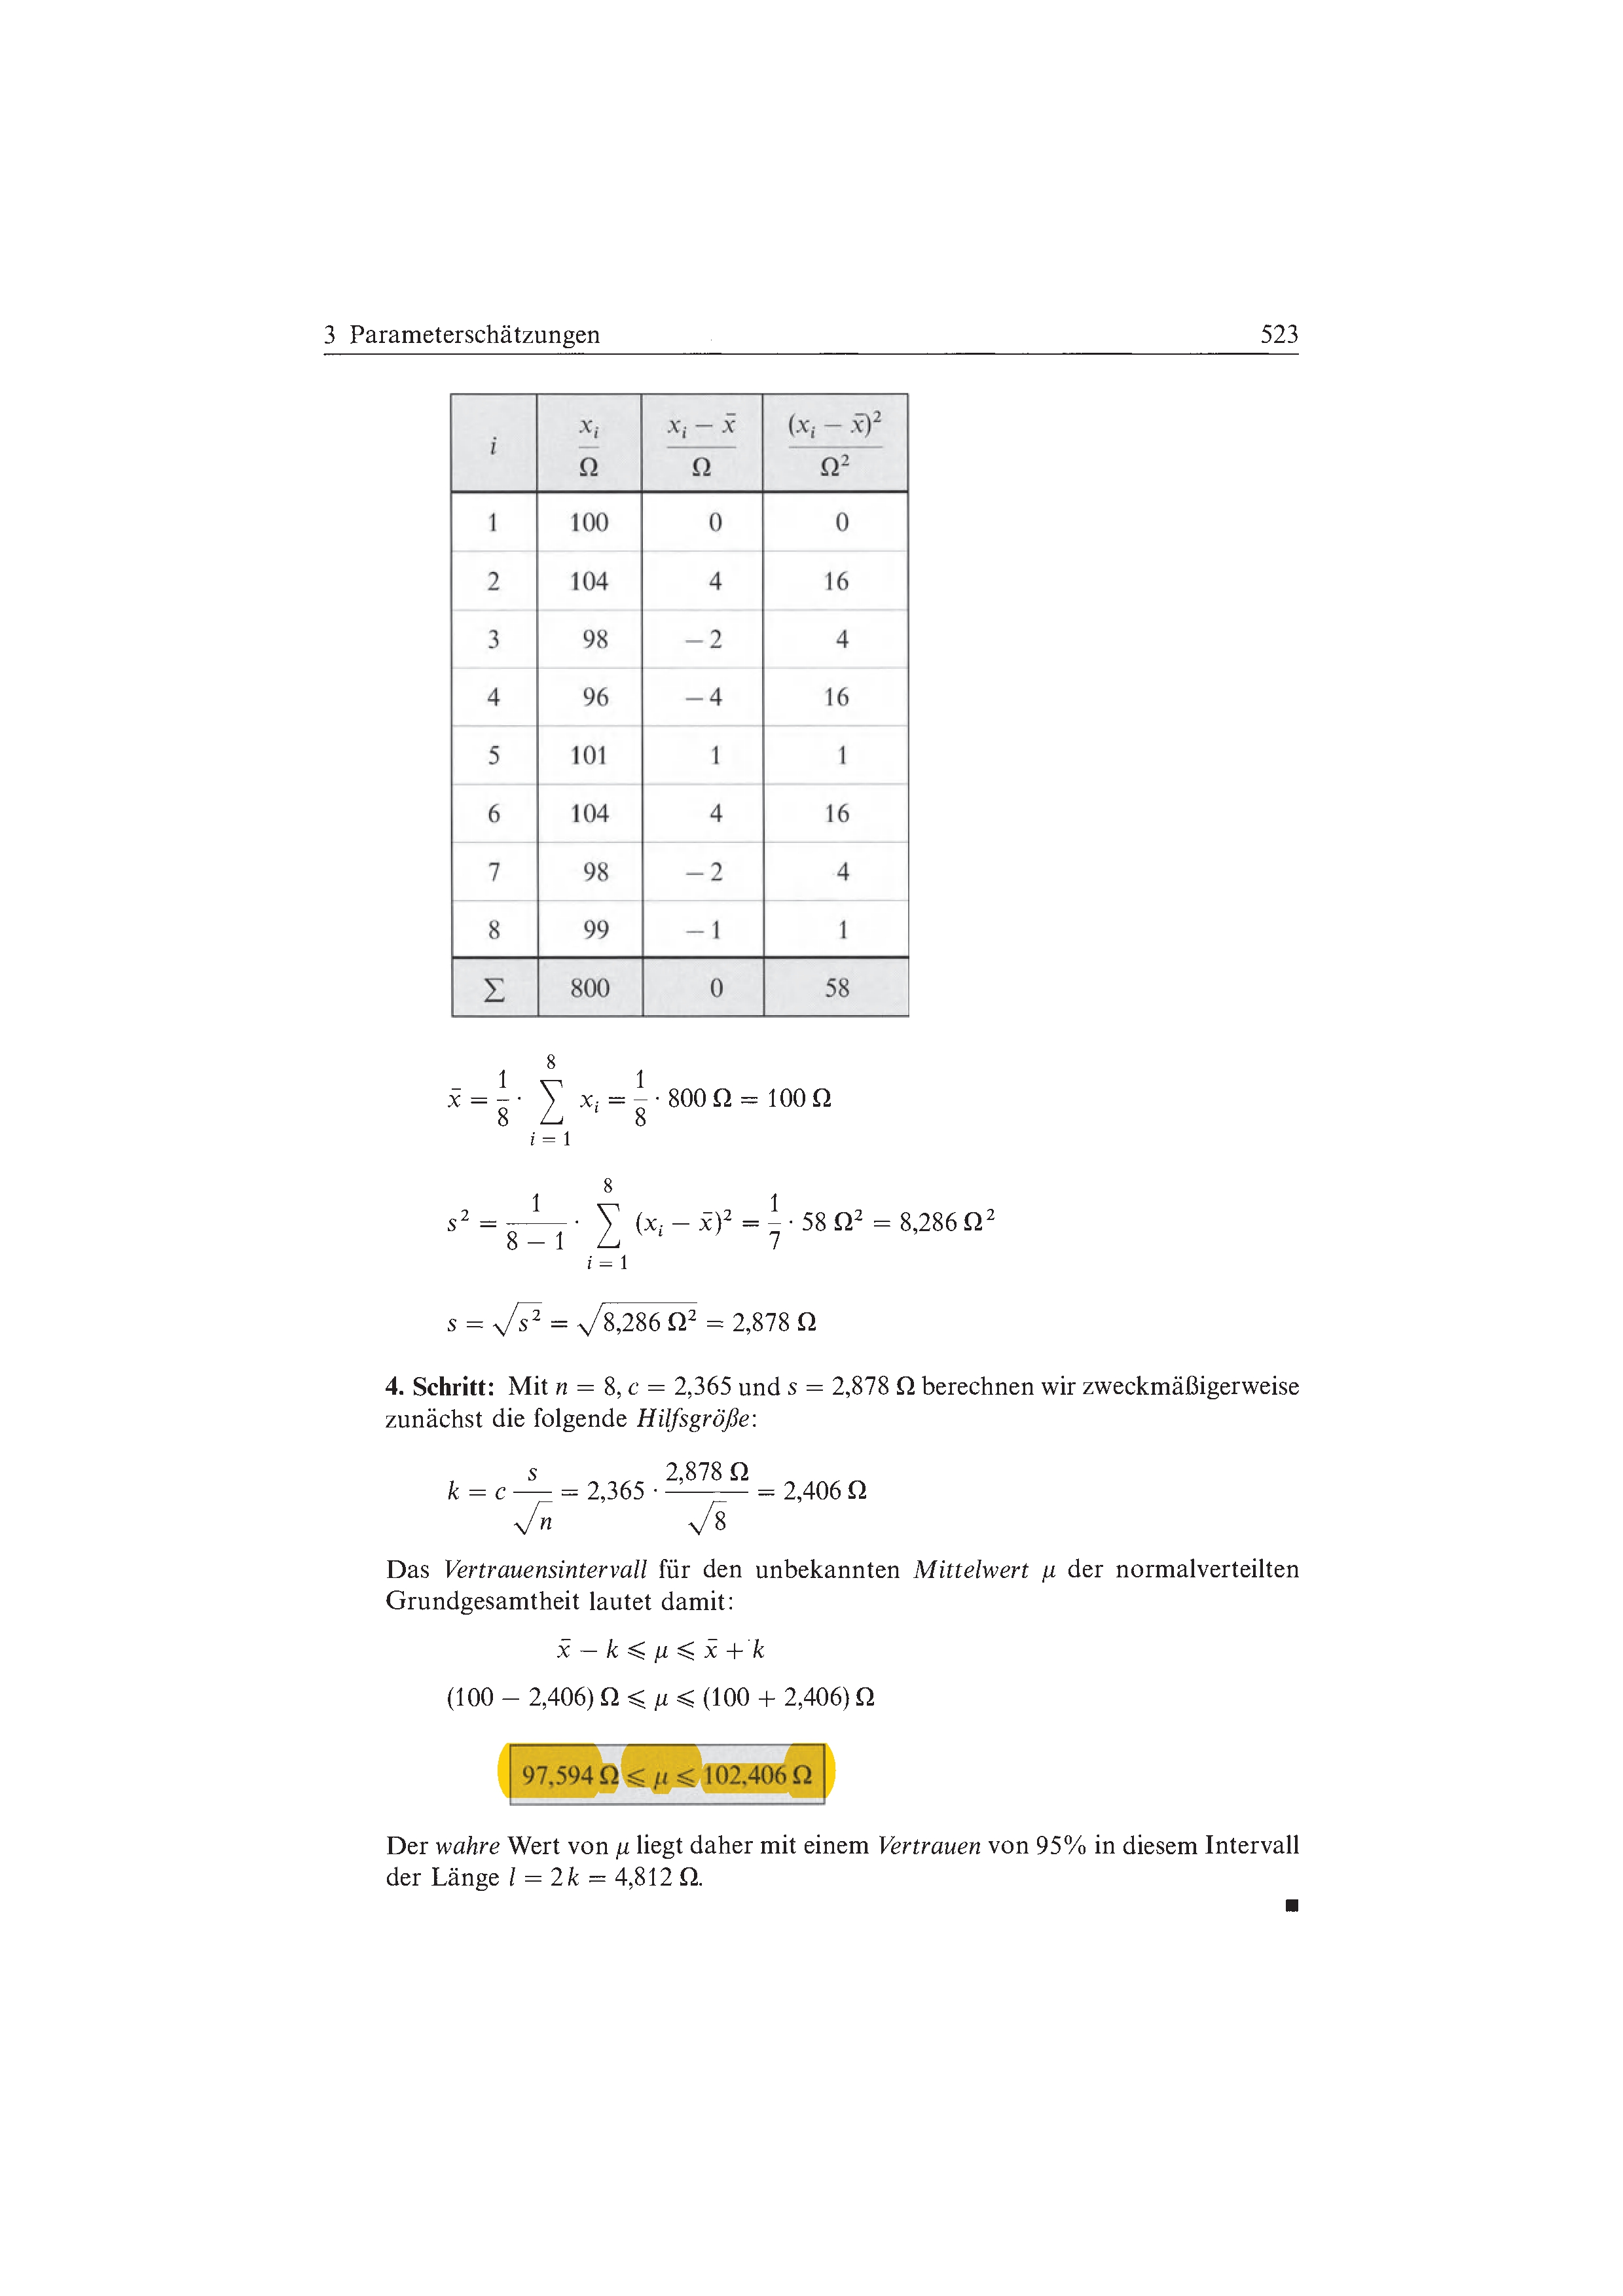
My calculation way is
n = 4
calculate mean and variance
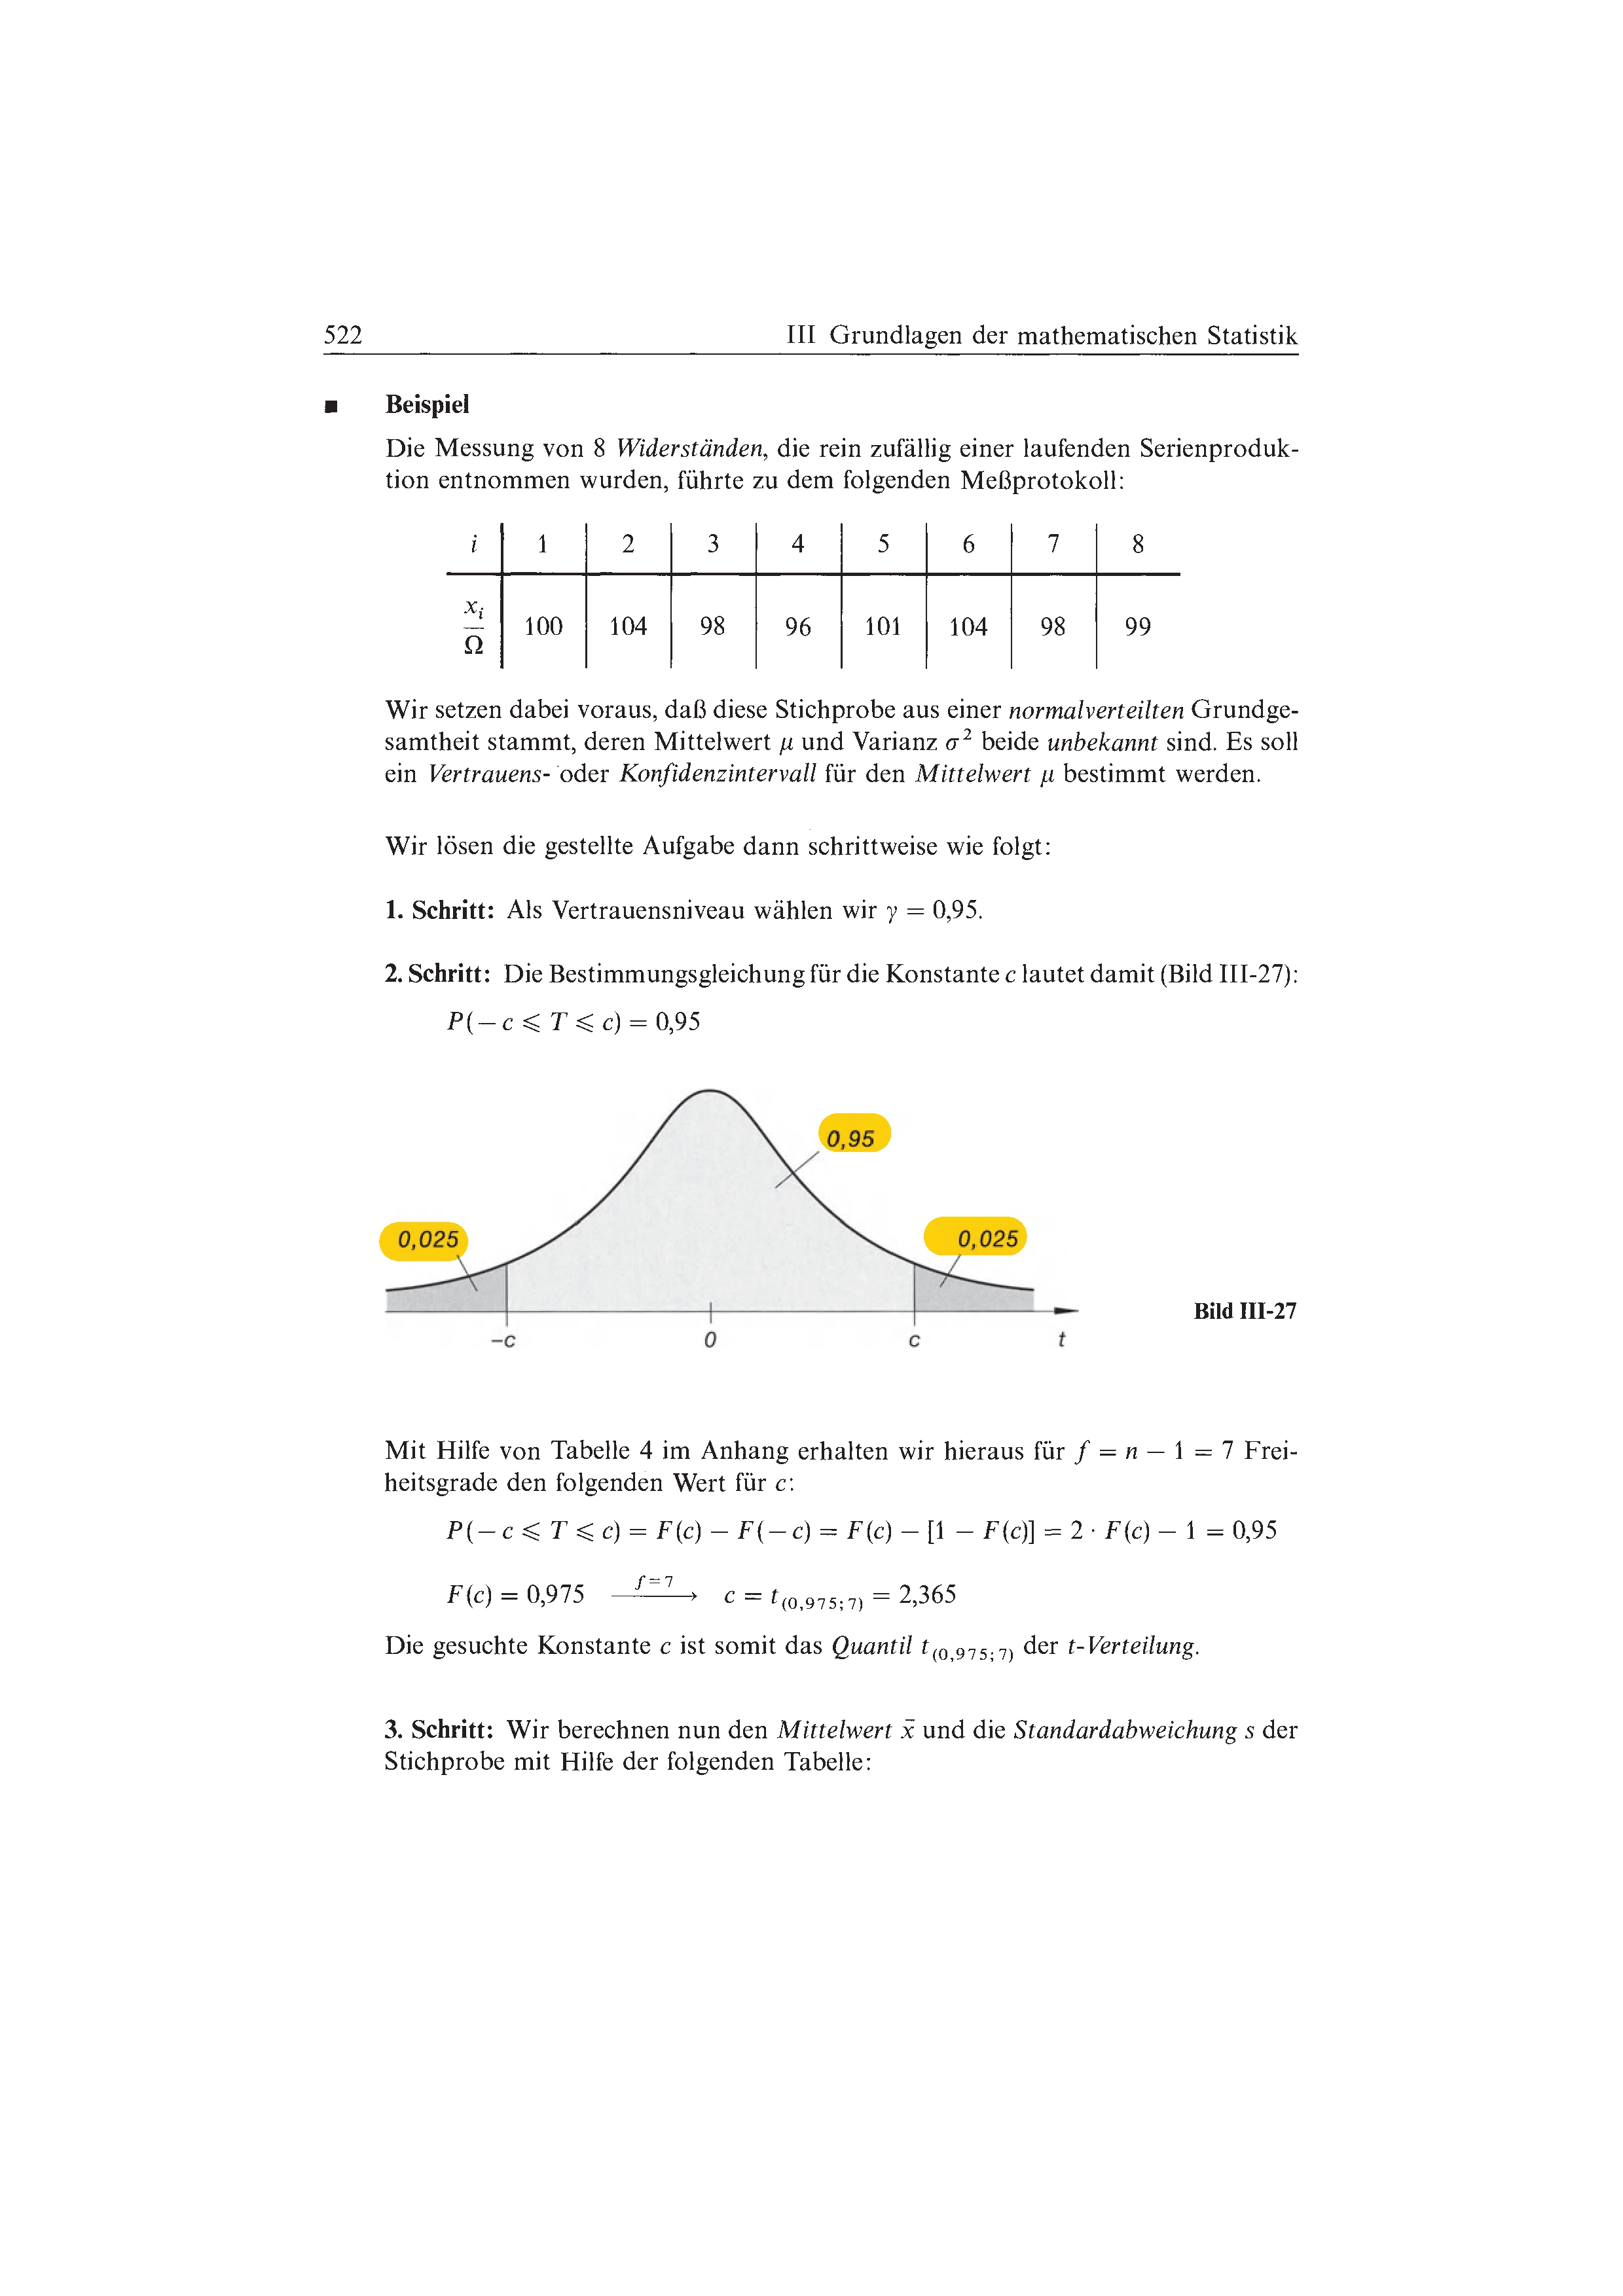
calculate c = value from table http://www.sjsu.edu/faculty/gerstman/StatPrimer/t-table.pdf for a 95% each side
df = n-1
(c*root(variance))/(root(n))=k
mean+-k = result
Thanks for you ideas,

- Mark as New
- Bookmark
- Subscribe
- Mute
- Subscribe to RSS Feed
- Get Direct Link
- Report Inappropriate Content
Re: Calculation of t-distribution, JMP 13
I have no idea what you are talking about.
By 'empty cell' I assume that you are talking about a new row in the data table. If so, you can select Rows > Add Rows or simply click in the first empty cell below the last row and enter a value.
I can't tell if the next statement is related but what are you doing that you get a mean of 18 for data all above 18?
Perhaps if you described, step by step, what you are doing and what informaiton you are examining, we could help. Posting a picture of the data and the JMP analyses would also be helpful.
- Mark as New
- Bookmark
- Subscribe
- Mute
- Subscribe to RSS Feed
- Get Direct Link
- Report Inappropriate Content
Re: Calculation of t-distribution, JMP 13
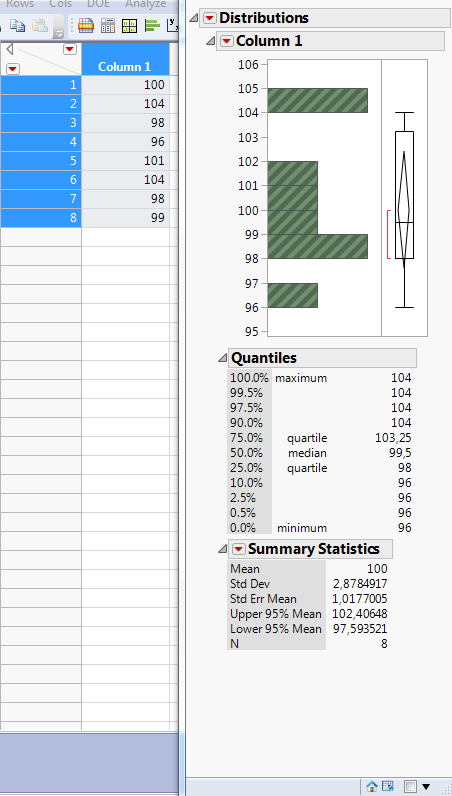
I added a picture below my previous post. But I think I figured out that the programm cant handle distribution with only marked cells. So they are just highlighted within the result of all values given in the chart.

- Mark as New
- Bookmark
- Subscribe
- Mute
- Subscribe to RSS Feed
- Get Direct Link
- Report Inappropriate Content
Re: Calculation of t-distribution, JMP 13
That is not how the analysis works in JMP. Selecting rows in the data table or through interactions with a plot has many uses but it alone does not change the analysis. If you prefer to work this way, It is possible. You need two commands in the platform menu so simply hold the Alt key and then click the red triangle at the top next to Distributions. Select Local Data Filter and Automatic Recalc, then click OK. Select Column 1 and then click Add. Now when you select one of the four levels from Column 1 (I - IV), the distribution analysis of columns 1, 2, and 3 will only use the rows for that group. (You don't need to include Column 1 in the Distribution platform any more because you are using the local data filter instead of the histogram to change the analysis.)
- Mark as New
- Bookmark
- Subscribe
- Mute
- Subscribe to RSS Feed
- Get Direct Link
- Report Inappropriate Content
Re: Calculation of t-distribution, JMP 13
- Mark as New
- Bookmark
- Subscribe
- Mute
- Subscribe to RSS Feed
- Get Direct Link
- Report Inappropriate Content
Re: Calculation of t-distribution, JMP 13
Try this: press and hold the Ctrl key, click the red triangle next to Summary Statistics, then change the confidence level to 0.9 for your desired level. Pressing the Ctrl key will broadcast the next command or action to all of the other objects in the window and they respond in kind if they are able.
- Mark as New
- Bookmark
- Subscribe
- Mute
- Subscribe to RSS Feed
- Get Direct Link
- Report Inappropriate Content
Re: Calculation of t-distribution, JMP 13
- Mark as New
- Bookmark
- Subscribe
- Mute
- Subscribe to RSS Feed
- Get Direct Link
- Report Inappropriate Content
Re: Calculation of t-distribution, JMP 13
While you do not need to look up t quantiles, here is a JMP data table with the sample size N and the corresponding t quantile for a two-sided confidence interval with the given Confidence.
It might be easier to use than the table that you cited.
- Mark as New
- Bookmark
- Subscribe
- Mute
- Subscribe to RSS Feed
- Get Direct Link
- Report Inappropriate Content
Re: Calculation of t-distribution, JMP 13
The whole calculation was already done with excel. I just need to double check it with the jmp software. It is recommended to use this software for boxplot at my university, but if the result is different, than my calculation, I cant use it. If both is the same, everything was done right :)
- Mark as New
- Bookmark
- Subscribe
- Mute
- Subscribe to RSS Feed
- Get Direct Link
- Report Inappropriate Content
Re: Calculation of t-distribution, JMP 13
The value used by JMP is the same as the one that you should use from the table that you cited:

(two-tails at 0.05)
- Mark as New
- Bookmark
- Subscribe
- Mute
- Subscribe to RSS Feed
- Get Direct Link
- Report Inappropriate Content
Re: Calculation of t-distribution, JMP 13
What is the exact meaning of the "upper" and "lower 95% mean"?
I attached a task and get the same value for a lower and higher 97,5% interval. It is a little bit confusing.
Or is 95% the two sided interval arround the mean? So how can I get a "upper" and "lower 90% mean", so I get the value for the lowest and highest 5%?
Recommended Articles
- © 2026 JMP Statistical Discovery LLC. All Rights Reserved.
- Terms of Use
- Privacy Statement
- Contact Us