- Discovery Summit 2026: Early User Edition - September 23-24.Register. It's free.
- Graph Builder Toolbar streamlines interactive graphing. Creates shortcuts on Report and GraphBuilder Helpers toolbars. Download and install the extension.
- Subscribe to RSS Feed
- Mark Topic as New
- Mark Topic as Read
- Float this Topic for Current User
- Bookmark
- Subscribe
- Mute
- Printer Friendly Page
Discussions
Solve problems, and share tips and tricks with other JMP users.- User Community
- :
- Discussions
- :
- Re: Calculation a p-value in a data table (regression) using row formulae

- Mark as New
- Bookmark
- Subscribe
- Mute
- Subscribe to RSS Feed
- Get Direct Link
- Report Inappropriate Content
Calculation a p-value in a data table (regression) using row formulae
Background: Suppose I have rows of x, y data (SN_C, Value [Sigma Units]) as shown in attached file but also pasted below.
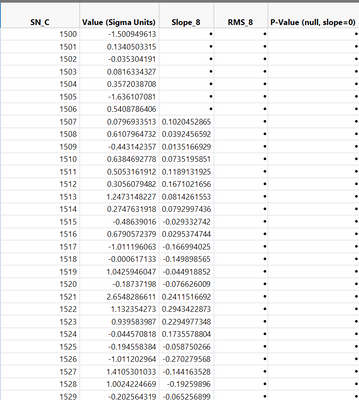
Slope_8 is calculated from the previous 8 [x.y] values.
I want to compare the slope_8 value to the null hypothesis for linear regression (slope =0) and provide a p-value. Is there an easy way to do this?
The formula for the slope 8 was taken from these discussion boards (@txnelson, @Mark_Bailey)and does exactly what I want after I did simple modification to use N=8
If( Row() > 7,
	x = J( 8, 1, 1 ) || :SN_C[Index( Row() - 7, Row() )]`;
	y = :"Value (Sigma Units)"n[Index( Row() - 7, Row() )]`;
	(Inv( x` * x ) * x` * y)[2];
)
I know I should know how to do this and my apologies for being too stupid to figure it out. Its been 30 years since I've taken matrix algebra :)
Accepted Solutions


- Mark as New
- Bookmark
- Subscribe
- Mute
- Subscribe to RSS Feed
- Get Direct Link
- Report Inappropriate Content
Re: Calculation a p-value in a data table (regression) using row formulae
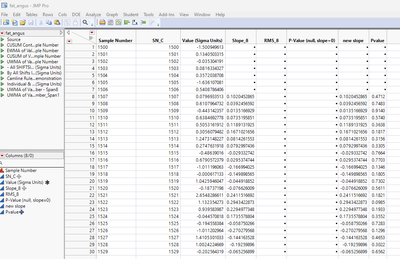
I think you can get what you want from the Linear Regression() function. Take a look in the Scripting Guide for the definition and example of how to use it. Below, I created 2 new columns, "New Slope" and "PValue". I set the format for the PValue column to "PVALUE". I then set the formula for the PValue column to
If( Row() > 7,
	dt = Current Data Table();
	x = dt[Index( Row() - 7, Row() ), 2];
	y = dt[Index( Row() - 7, Row() ), 3];
	{Estimates, Std_Error, Diagnostics} = Linear Regression( y, x );
	:New Slope[Row()] = estimates[2];
	diagnostics["p_value"][1];
);
Here is the display
If( Row() > 7,
	dt = Current Data Table();
	x = dt[Index( Row() - 7, Row() ), 2];
	y = dt[Index( Row() - 7, Row() ), 3];
	{Estimates, Std_Error, Diagnostics} = Linear Regression( y, x );
	:new slope[Row()] = estimates[2];
	diagnostics["p_value"][1];
)
- Mark as New
- Bookmark
- Subscribe
- Mute
- Subscribe to RSS Feed
- Get Direct Link
- Report Inappropriate Content
Re: Calculation a p-value in a data table (regression) using row formulae
I think you can get what you want from the Linear Regression() function. Take a look in the Scripting Guide for the definition and example of how to use it. Below, I created 2 new columns, "New Slope" and "PValue". I set the format for the PValue column to "PVALUE". I then set the formula for the PValue column to
If( Row() > 7,
	dt = Current Data Table();
	x = dt[Index( Row() - 7, Row() ), 2];
	y = dt[Index( Row() - 7, Row() ), 3];
	{Estimates, Std_Error, Diagnostics} = Linear Regression( y, x );
	:New Slope[Row()] = estimates[2];
	diagnostics["p_value"][1];
);
Here is the display
If( Row() > 7,
	dt = Current Data Table();
	x = dt[Index( Row() - 7, Row() ), 2];
	y = dt[Index( Row() - 7, Row() ), 3];
	{Estimates, Std_Error, Diagnostics} = Linear Regression( y, x );
	:new slope[Row()] = estimates[2];
	diagnostics["p_value"][1];
)
- Mark as New
- Bookmark
- Subscribe
- Mute
- Subscribe to RSS Feed
- Get Direct Link
- Report Inappropriate Content
Re: Calculation a p-value in a data table (regression) using row formulae
txnelson... thanks so much. This was exactly what I was looking for. I sincerely appreciate this.
Recommended Articles
- © 2026 JMP Statistical Discovery LLC. All Rights Reserved.
- Terms of Use
- Privacy Statement
- Contact Us