- Subscribe to RSS Feed
- Mark Topic as New
- Mark Topic as Read
- Float this Topic for Current User
- Bookmark
- Subscribe
- Mute
- Printer Friendly Page
Discussions
Solve problems, and share tips and tricks with other JMP users.- JMP User Community
- :
- Discussions
- :
- Re: Calculating and Plotting Percent of Increase
- Mark as New
- Bookmark
- Subscribe
- Mute
- Subscribe to RSS Feed
- Get Direct Link
- Report Inappropriate Content
Calculating and Plotting Percent of Increase
Hi. New to JMP.
I am plotting resistance values over time from a csv dump. How do I calculate and plot the percent of increase or delta? Tab or script.
I am collecting data from 99 boards and reading 5 channels per board over time (10x).
I am able to plot the resistance data over time.
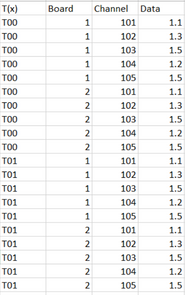
Table looks like this:
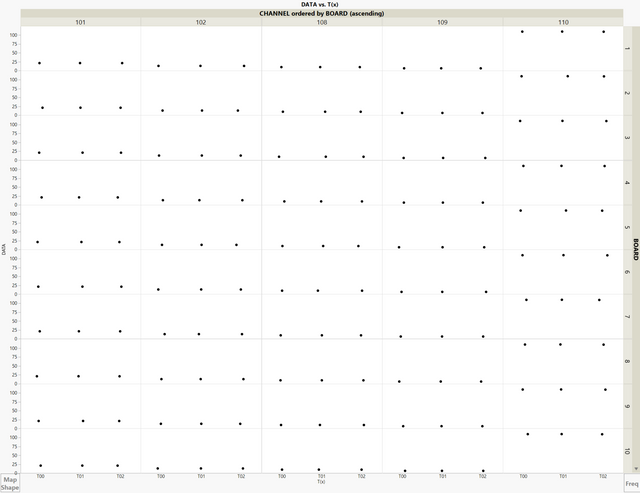
Graph: Shows resistance values on the left. I want to plot the percent of change increase or decrease.
Is it possible to do this?
Thanks!
Accepted Solutions
- Mark as New
- Bookmark
- Subscribe
- Mute
- Subscribe to RSS Feed
- Get Direct Link
- Report Inappropriate Content
Re: Calculating and Plotting Percent of Increase
Is it possible to do this?
@rmiyasato, Welcome to the community! And yes, anything is possible if you believe in yourself and work hard to achieve your dreams.
What isn't clear is if you want to compute the percentage difference from T00 for all subsequent time points, or the percentage difference from the previous time point. I'll describe both.
Start by sorting your data by BOARD, CHANNEL, and T(x) in that order using Tables > Sort.
% Difference from Previous Time Point
Add a new column with this formula: (you can copy and paste right into the table)
If( :Name( "T(X)" ) != "T00",
	(:Data[Row()] - :Data[Row() - 1]) / :Data[Row() - 1],
	0
)
This uses the row() function to compute the difference of Data in the current row from the previous row, and divide the difference by the value of the previous row.
Format the column to have a Percent format via Column Info.
% Difference from T00
For this, we'll create 2 new columns. The first is purely auxiliary and will contain the T00 value for the current Board/Channel combination. I called the column "T00 Value" and used this column formula:
If( :Name( "T(X)" ) == "T00",
	:Data,
	:T00 Value[Row() - 1]
);
It has a recursive reference to itself, which is normally bad practice.
Next, we'll compute the %Difference from T00 in another new column using this column formula:
(:Data - :T00 Value) / :T00 ValueChange the format to a Percent format.
Here's what the result looks like with my made up table:
I'm attaching this table to this post.
**Note: I should add that if you resort your table again, all the formulas will re-evaluate and screw everything up. You can just remove the formulas so the values are static.
- Mark as New
- Bookmark
- Subscribe
- Mute
- Subscribe to RSS Feed
- Get Direct Link
- Report Inappropriate Content
Re: Calculating and Plotting Percent of Increase
Hi, rmiyasato!
Welcome. Of course, this is possible.
% change is, of course, dependent upon the specification of values in the numerator and denominator of the equation.
Do you wish % change from starting values? From each subsequent value?
- Mark as New
- Bookmark
- Subscribe
- Mute
- Subscribe to RSS Feed
- Get Direct Link
- Report Inappropriate Content
Re: Calculating and Plotting Percent of Increase
From the starting value.
- Mark as New
- Bookmark
- Subscribe
- Mute
- Subscribe to RSS Feed
- Get Direct Link
- Report Inappropriate Content
Re: Calculating and Plotting Percent of Increase
Here's my current script.
PROBEDATA = Open(
Pick File(),
columns(
Column( "SCANID", Character, "Nominal" ),
Column( "IM#", Character, "Nominal" ),
Column( "LREQ", Numeric, "Continuous", Format( "Best", 10 ) ),
Column(
"DATE/TIME",
Numeric,
"Continuous",
Format( "m/d/y h:m:s", 23, 0 ),
Input Format( "m/d/y h:m:s", 0 )
),
Column( "T(x)", Character, "Nominal" ),
Column( "BOARD", Numeric, "Continuous", Format( "Best", 10 ) ),
Column( "CHANNEL", Numeric, "Continuous", Format( "Best", 10 ) ),
Column( "DATA", Numeric, "Continuous", Format( "Best", 10 ) )
),
Import Settings(
End Of Line( CRLF, CR, LF ),
End Of Field( Comma, CSV( 0 ) ),
Strip Quotes( 1 ),
Use Apostrophe as Quotation Mark( 0 ),
Scan Whole File( 1 ),
Treat empty columns as numeric( 0 ),
CompressNumericColumns( 0 ),
CompressCharacterColumns( 0 ),
CompressAllowListCheck( 0 ),
Labels( 1 ),
Column Names Start( 1 ),
Data Starts( 2 ),
Lines To Read( "All" ),
Year Rule( "20xx" )
)
);

PROBEDATA << Graph Builder(
Size( 1750, 1245 ),
Automatic Recalc( 0 ),
Variables(
X( :Name( "T(x)" ) ),
Y( :DATA ),
Group X(
:CHANNEL,
Order By( :BOARD, Ascending, Order Statistic( "Mean" ) )
),
Group Y( :BOARD, Levels( 99 ), N View Levels( 10 ) )
),
Elements(
Points( X, Y, Legend( 53 ) ),
Caption Box(
X,
Y,
Legend( 54 ),
Summary Statistic( "Range" ),
X Position( "Left" )
)
)
)- Mark as New
- Bookmark
- Subscribe
- Mute
- Subscribe to RSS Feed
- Get Direct Link
- Report Inappropriate Content
Re: Calculating and Plotting Percent of Increase
Is it possible to do this?
@rmiyasato, Welcome to the community! And yes, anything is possible if you believe in yourself and work hard to achieve your dreams.
What isn't clear is if you want to compute the percentage difference from T00 for all subsequent time points, or the percentage difference from the previous time point. I'll describe both.
Start by sorting your data by BOARD, CHANNEL, and T(x) in that order using Tables > Sort.
% Difference from Previous Time Point
Add a new column with this formula: (you can copy and paste right into the table)
If( :Name( "T(X)" ) != "T00",
	(:Data[Row()] - :Data[Row() - 1]) / :Data[Row() - 1],
	0
)
This uses the row() function to compute the difference of Data in the current row from the previous row, and divide the difference by the value of the previous row.
Format the column to have a Percent format via Column Info.
% Difference from T00
For this, we'll create 2 new columns. The first is purely auxiliary and will contain the T00 value for the current Board/Channel combination. I called the column "T00 Value" and used this column formula:
If( :Name( "T(X)" ) == "T00",
	:Data,
	:T00 Value[Row() - 1]
);
It has a recursive reference to itself, which is normally bad practice.
Next, we'll compute the %Difference from T00 in another new column using this column formula:
(:Data - :T00 Value) / :T00 ValueChange the format to a Percent format.
Here's what the result looks like with my made up table:
I'm attaching this table to this post.
**Note: I should add that if you resort your table again, all the formulas will re-evaluate and screw everything up. You can just remove the formulas so the values are static.
- Mark as New
- Bookmark
- Subscribe
- Mute
- Subscribe to RSS Feed
- Get Direct Link
- Report Inappropriate Content
Re: Calculating and Plotting Percent of Increase
Recommended Articles
- © 2026 JMP Statistical Discovery LLC. All Rights Reserved.
- Terms of Use
- Privacy Statement
- Contact Us


