- Instantly extract effect sizes, F-ratios, and FDR-adjusted p-values from your models with the Calculate Effects Sizes extension, available now in the JMP Marketplace!
- New to JMP? Join us Sept. 23-24 for the Early User Edition of Discovery Summit, tailor-made for new users. Register now for free!
- See how to use the JMP Marketplace – Free tools to expand JMP capabilities. Register. July 10, 2 pm US Eastern Time.
- Subscribe to RSS Feed
- Mark Topic as New
- Mark Topic as Read
- Float this Topic for Current User
- Bookmark
- Subscribe
- Mute
- Printer Friendly Page
Discussions
Solve problems, and share tips and tricks with other JMP users.- JMP User Community
- :
- Discussions
- :
- Bulk change to log scale and color of reference line

- Mark as New
- Bookmark
- Subscribe
- Mute
- Subscribe to RSS Feed
- Get Direct Link
- Report Inappropriate Content
Bulk change to log scale and color of reference line
Hi,
I used "fit y by x" in JMP16 to generate about 25 graphs. How can I change all of their scales to log scale without going to individual graph's axis settings please?
Also, each one of the graphs have their unique USL that gets displayed a reference line in color blue. How could I change all the 25 reference line's color from blue to red please?
Thanks!

- Mark as New
- Bookmark
- Subscribe
- Mute
- Subscribe to RSS Feed
- Get Direct Link
- Report Inappropriate Content
Re: Bulk change to log scale and color of reference line
If you used a variable with 25 levels in the By role so that all the plots are in the same window, then right-click on the axis that you changed and select Copy Axis Settings. Then press and hold the CTRL key (Windows) or the Command key (Mac), right-click on the axis of another plot and select Paste Axis Settings.
- Mark as New
- Bookmark
- Subscribe
- Mute
- Subscribe to RSS Feed
- Get Direct Link
- Report Inappropriate Content
Re: Bulk change to log scale and color of reference line
Hi Mark,
Thanks for sharing the tip. Unfortunately, when I do that following 2 things happen,
- The y-axis data range is different for all the 25 graphs and hence upon pasting the axis settings the data points move outside of the visible range.
- Each graph has its own unique spec limit, thus, when i paste the axis settings the spec limits from source graph gets pasted to the new graph and i have more than 1 spec limit
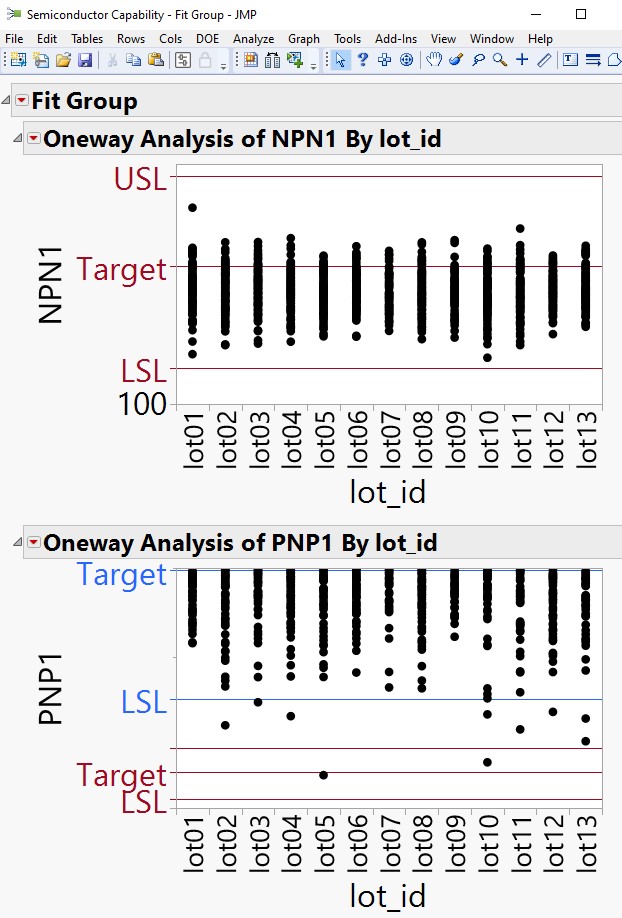
I have attached semiconductor capability.jmp as an example. See script "Fit Y by X - log scale 2" please
- Mark as New
- Bookmark
- Subscribe
- Mute
- Subscribe to RSS Feed
- Get Direct Link
- Report Inappropriate Content
Re: Bulk change to log scale and color of reference line
I think that the solution might be more complicated than I thought at first. It will require scripting. I do not have time to write a script at the moment.

- Mark as New
- Bookmark
- Subscribe
- Mute
- Subscribe to RSS Feed
- Get Direct Link
- Report Inappropriate Content
Re: Bulk change to log scale and color of reference line
Changing Y-axis is fairly easy
Names Default To Here(1);

dt = Open("$SAMPLE_DATA/Semiconductor Capability.jmp");

fg = dt << Fit Group(
	Oneway(Y(:NPN1), X(:lot_id)),
	Oneway(Y(:PNP1), X(:lot_id)),
	Oneway(Y(:PNP2), X(:lot_id)),
	Oneway(Y(:NPN2), X(:lot_id)),
	Oneway(Y(:PNP3), X(:lot_id)),
	<<{Arrange in Rows(1)}
);

axis_box_refs = (Report(fg) << XPath("//OutlineBox[starts-with(text(), 'Oneway Analysis of')]//AxisBox"));
axis_box_refs[1::N Items(axis_box_refs)::2] << Scale("Log");
updating colors of reference lines is most likely a bit more difficult and and will depend on where you are getting the limits from.
- Mark as New
- Bookmark
- Subscribe
- Mute
- Subscribe to RSS Feed
- Get Direct Link
- Report Inappropriate Content
Re: Bulk change to log scale and color of reference line
Thanks jthi. This worked for changing to log scale
Recommended Articles
- © 2026 JMP Statistical Discovery LLC. All Rights Reserved.
- Terms of Use
- Privacy Statement
- Contact Us