- Don’t miss your chance to experience Discovery Summit Europe at our best available rate! Early bird registration through 31 Oct.
- Graph Builder Toolbar streamlines interactive graphing. Creates shortcuts on Report and GraphBuilder Helpers toolbars. Download and install the extension.
- Subscribe to RSS Feed
- Mark Topic as New
- Mark Topic as Read
- Float this Topic for Current User
- Bookmark
- Subscribe
- Mute
- Printer Friendly Page
Discussions
Solve problems, and share tips and tricks with other JMP users.- User Community
- :
- Discussions
- :
- Bubble Plot Display in JMP

- Mark as New
- Bookmark
- Subscribe
- Mute
- Subscribe to RSS Feed
- Get Direct Link
- Report Inappropriate Content
Bubble Plot Display in JMP
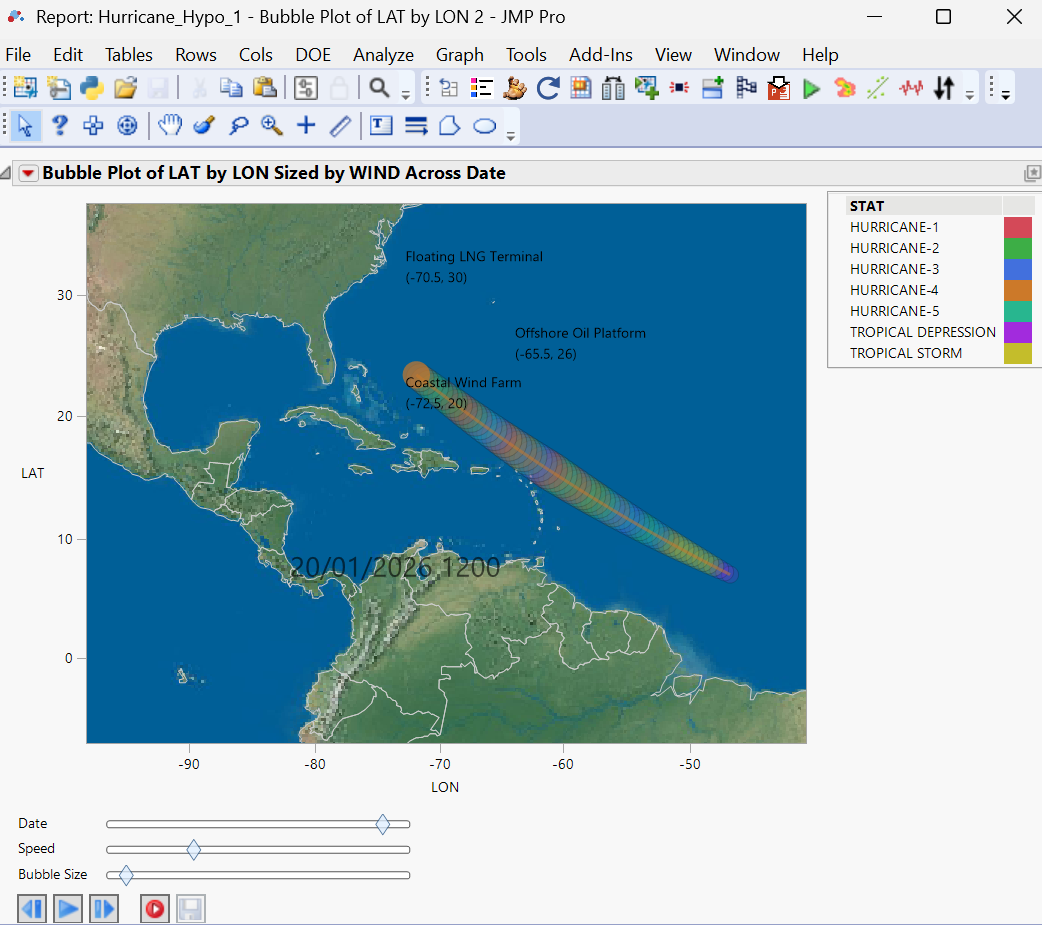
Following the example in the JMP library using the “Katrina Data,” I created a new dataset for a hypothetical hurricane (Hurricane_Hypo_1) and generated a corresponding Bubble Plot.
However, I’ve encountered two issues:
- Path Display: In my plot, only a single moving bubble is shown without a tail indicating its trajectory. I suspect this may be related to the animation or display settings, but I haven’t been able to resolve it.
- Stationary Reference Points: I would like to display four fixed coordinate points, i.e., (-40, 5), (-50, 10), (-60, 15), and (-70, 20), on the map while the bubble moves. These represent installations, and I intend to visually compare their proximity to the hurricane’s path.
Any guidance or suggestions on how to address these two visualisation issues would be greatly appreciated.
Accepted Solutions


- Mark as New
- Bookmark
- Subscribe
- Mute
- Subscribe to RSS Feed
- Get Direct Link
- Report Inappropriate Content
Re: Bubble Plot Display in JMP
You just need to change your first line to:
bp = Bubble Plot("bp" is the variable name for the Bubble Plot that is used further down in the script.

- Mark as New
- Bookmark
- Subscribe
- Mute
- Subscribe to RSS Feed
- Get Direct Link
- Report Inappropriate Content
Re: Bubble Plot Display in JMP
This now works fine. Thank you


- Mark as New
- Bookmark
- Subscribe
- Mute
- Subscribe to RSS Feed
- Get Direct Link
- Report Inappropriate Content
Re: Bubble Plot Display in JMP
There is trail lines in red triangle menu

You can add those with graphic script or with annotate tool

Marker Size(5);
Marker([-40, -50, -60, -70], [5, 10, 15, 20])
- Mark as New
- Bookmark
- Subscribe
- Mute
- Subscribe to RSS Feed
- Get Direct Link
- Report Inappropriate Content
Re: Bubble Plot Display in JMP
Thank you, Jarmo, for your assistance. I've marked the hurricane path and identified three key infrastructures on the map using the annotate tool. However, I'm uncertain about how to script these elements using graphic script (please see the attachment).
I came across the following link, but I'm unsure how to access the "Customize Graph" option in order to add the marker script.
Create Shapes for a Bubble Plot
- Mark as New
- Bookmark
- Subscribe
- Mute
- Subscribe to RSS Feed
- Get Direct Link
- Report Inappropriate Content
Re: Bubble Plot Display in JMP
Right click on the graph, select Customize, press "+" and then you can add new graphic script. This isn't anything specific to bubble plot and works in all of the graphs in JMP.


- Mark as New
- Bookmark
- Subscribe
- Mute
- Subscribe to RSS Feed
- Get Direct Link
- Report Inappropriate Content
Re: Bubble Plot Display in JMP
You can add the custom graphics (markers, text, lines, etc.) using JSL by using the command << add graphics script. The scripting index has many examples on the possibilities.
I updated your original script with Jarmo's suggestion. I think you should be able to modify this to your specific script.

// assign the bubble plot to a variable
bp = Bubble Plot(
	X( :LON ),
	Y( :LAT ),
	Sizes( :WIND ),
	Time( :Date ),
	Coloring( :STAT ),
	Title Position( -73.86, 8.76 ),
	SendToReport(
		Dispatch( {}, "LON", ScaleBox,
			{Format( "Best", 9 ), Min( -81 ), Max( -39 ), Inc( 10 ),
			Minor Ticks( 1 )}
		),
		Dispatch( {}, "LAT", ScaleBox,
			{Scale( "Geodesic" ), Format( "Best", 9 ), Min( 2.25 ), Max( 33.75 ),
			Inc( 5 ), Minor Ticks( 0 )}
		),
		Dispatch( {}, "Bubble Plot", FrameBox,
			{Background Color( 73 ), Background Map(
				Images( "Simple Earth" ),
				Boundaries( "World" )
			)}
		)
	)
);

// find the framebox in the bubble plot for the graphics script
fb = report( bp )[framebox(1)];

// add the custom script
fb << add graphics script(
	Marker Size(5);
	Marker([-40, -50, -60, -70], [5, 10, 15, 20]);

	text(
		{-40, 5}, "Station 1",
		{-50, 10}, "Station 2",
		{-60, 15}, "Station 3",
		{-70, 20}, "Station 4",
	)
);
You will now notice that this graphics script is saved to the graph when you right click >> Customize...

- Mark as New
- Bookmark
- Subscribe
- Mute
- Subscribe to RSS Feed
- Get Direct Link
- Report Inappropriate Content
Re: Bubble Plot Display in JMP
Hi Scott,
Thank you for your note. I followed the steps you outlined, but used different stations (with updated coordinates and names) when running the script. Unfortunately, it's not working as expected. Please see the attached file for reference.
Could you kindly review and let me know where I may have gone wrong?
Best regards,
Madhu
- Mark as New
- Bookmark
- Subscribe
- Mute
- Subscribe to RSS Feed
- Get Direct Link
- Report Inappropriate Content
Re: Bubble Plot Display in JMP
Bubble Plot(
	X( :LON ),
	Y( :LAT ),
	Sizes( :WIND ),
	Time( :Date ),
	Coloring( :STAT ),
	Bubble Size( 19.8 ),
	Time Index( 31.4000000000002 ),
	Trail Bubbles( "All" ),
	Trail Lines( "All" ),
	Title Position( -73.1193700214385, 8.11202650369562 ),
	SendToReport(
		Dispatch( {}, "LON", ScaleBox,
			{Format( "Best", 9 ), Min( -80 ), Max( -39.5257060084616 ), Inc( 10 ),
			Minor Ticks( 1 )}
		),
		Dispatch( {}, "LAT", ScaleBox,
			{Scale( "Geodesic" ), Format( "Best", 9 ), Min( 2.02558252288183 ),
			Max( 32.3813030165356 ), Inc( 5 ), Minor Ticks( 0 )}
		),
		Dispatch( {}, "Bubble Plot", FrameBox,
			{Background Map( Images( "Simple Earth" ), Boundaries( "World" ) )}
		)
	)
);
// find the framebox in the bubble plot for the graphics script
fb = report( bp )[framebox(1)];
// add the custom script
fb << add graphics script(
	Marker Size(5);
	Marker([-55, 62, -68], [15, 19, 22]);

	text(
		{-55, 15}, "Offshore Oil Platform",
		{-62, 19}, "Floating LNG Terminal",
		{-68, 22}, "Coastal Wind Farm",
	)
);- Mark as New
- Bookmark
- Subscribe
- Mute
- Subscribe to RSS Feed
- Get Direct Link
- Report Inappropriate Content
Re: Bubble Plot Display in JMP
You just need to change your first line to:
bp = Bubble Plot("bp" is the variable name for the Bubble Plot that is used further down in the script.
- Mark as New
- Bookmark
- Subscribe
- Mute
- Subscribe to RSS Feed
- Get Direct Link
- Report Inappropriate Content
Re: Bubble Plot Display in JMP
This now works fine. Thank you
Recommended Articles
- © 2026 JMP Statistical Discovery LLC. All Rights Reserved.
- Terms of Use
- Privacy Statement
- Contact Us