JMP Security Notice: CVE-2026-109618 and CVE-2026-109619
JMP promptly initiated a review of its products, services, and relevant infrastructure for exposure to CVE-2026-109618 and CVE-2026-109619.
Our assessment of JMP products has not identified exposure to these vulnerabilities. Where remediation was required within supporting environments, appropriate security updates and controls have been applied and validated.
We have identified no evidence of successful exploitation or unauthorized access to JMP systems or customer information associated with these vulnerabilities.
JMP continues to monitor the issue and relevant vendor guidance. No action is required by JMP customers at this time.
- Don’t miss your chance to experience Discovery Summit Europe at our best available rate! Early bird registration through 31 Oct.
- Graph Builder Toolbar streamlines interactive graphing. Creates shortcuts on Report and GraphBuilder Helpers toolbars. Download and install the extension.
- Subscribe to RSS Feed
- Mark Topic as New
- Mark Topic as Read
- Float this Topic for Current User
- Bookmark
- Subscribe
- Mute
- Printer Friendly Page
Discussions
Solve problems, and share tips and tricks with other JMP users.- User Community
- :
- Discussions
- :
- Re: Boxplot with distribution plot like aside in same chart

- Mark as New
- Bookmark
- Subscribe
- Mute
- Subscribe to RSS Feed
- Get Direct Link
- Report Inappropriate Content
Boxplot with distribution plot like aside in same chart
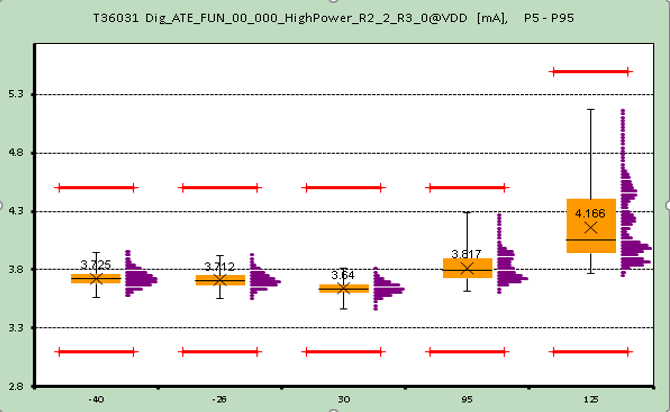
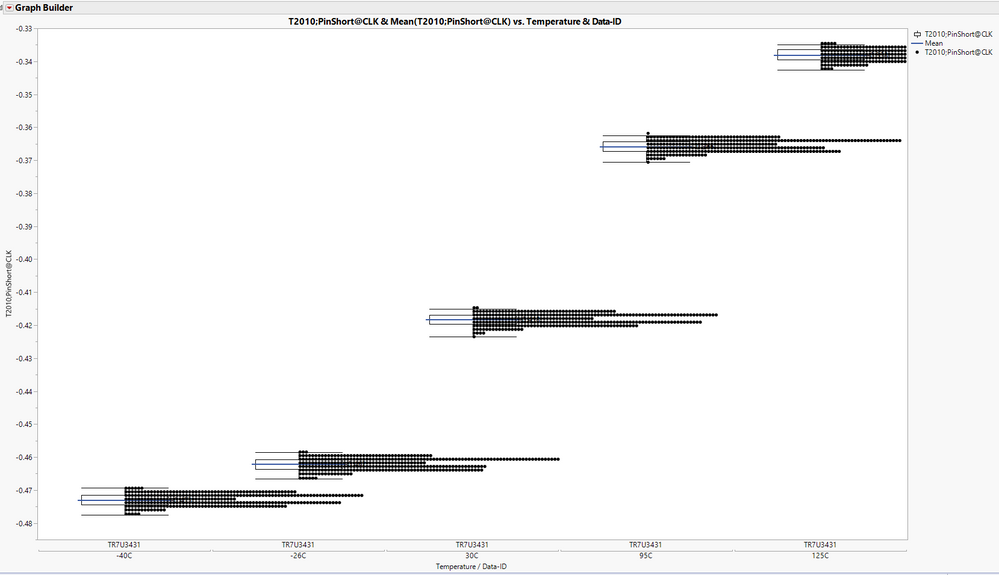
I wondering JMP able to plot boxplot and distribution side by side like the chart i show below? I try to use graph builder, combine boxplot and point plot together. Set the point chart jitter to positive grid, look a bit similar but the jitter point look really aweful, try to use the jitter limit to adjust, but there is no much can do. Any other suggestion that can make the boxplot and distribution plot side by side in better way? Any suggestion welcome. Thanks
Accepted Solutions


- Mark as New
- Bookmark
- Subscribe
- Mute
- Subscribe to RSS Feed
- Get Direct Link
- Report Inappropriate Content
Re: Boxplot with distribution plot like aside in same chart
The default box plot with histograms in JMP is:
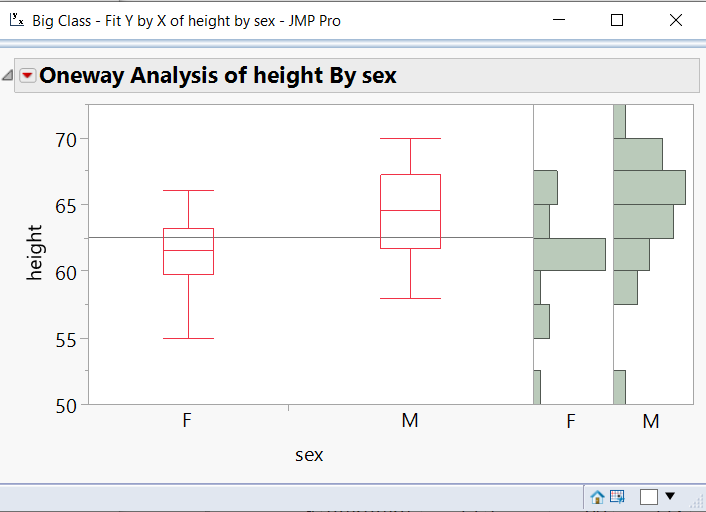
By clicking on the red triangle under the output from the Fit Y by X platform, the histograms can be selected.
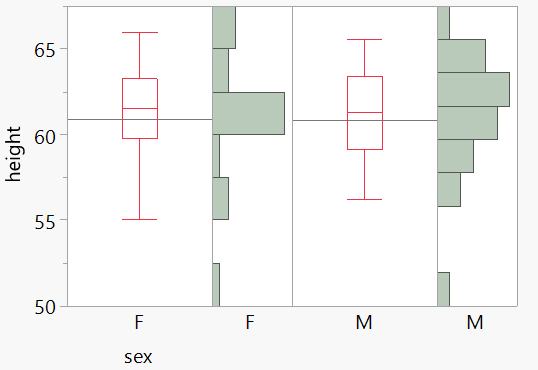
Additionally, if you get into scripting, you can do just about anything you want, such as the below mock up of one possible style


- Mark as New
- Bookmark
- Subscribe
- Mute
- Subscribe to RSS Feed
- Get Direct Link
- Report Inappropriate Content
Re: Boxplot with distribution plot like aside in same chart
JMP does not create exactly the same chart. Try Analyze > Distribution. It plots the histogram and box plot automatially for each variable you enter in the Y role.
- Mark as New
- Bookmark
- Subscribe
- Mute
- Subscribe to RSS Feed
- Get Direct Link
- Report Inappropriate Content
Re: Boxplot with distribution plot like aside in same chart
The default box plot with histograms in JMP is:
By clicking on the red triangle under the output from the Fit Y by X platform, the histograms can be selected.
Additionally, if you get into scripting, you can do just about anything you want, such as the below mock up of one possible style
- Mark as New
- Bookmark
- Subscribe
- Mute
- Subscribe to RSS Feed
- Get Direct Link
- Report Inappropriate Content
Re: Boxplot with distribution plot like aside in same chart
This look closer than what i want.

- Mark as New
- Bookmark
- Subscribe
- Mute
- Subscribe to RSS Feed
- Get Direct Link
- Report Inappropriate Content
Re: Boxplot with distribution plot like aside in same chart
i need to know, in graph builder ( Boxplot ) it is possible to create distribution with CPK..?
Recommended Articles
- © 2026 JMP Statistical Discovery LLC. All Rights Reserved.
- Terms of Use
- Privacy Statement
- Contact Us