- Instantly extract effect sizes, F-ratios, and FDR-adjusted p-values from your models with the Calculate Effects Sizes extension, available now in the JMP Marketplace!
- New to JMP? Join us Sept. 23-24 for the Early User Edition of Discovery Summit, tailor-made for new users. Register now for free!
- Use World Cup data to build models, explore spatial relationships, and create informative visualizations in JMP. Register. July 17, 2 pm US Eastern Time.
- Subscribe to RSS Feed
- Mark Topic as New
- Mark Topic as Read
- Float this Topic for Current User
- Bookmark
- Subscribe
- Mute
- Printer Friendly Page
Discussions
Solve problems, and share tips and tricks with other JMP users.- JMP User Community
- :
- Discussions
- :
- Bar graphs - Please HELP!

- Mark as New
- Bookmark
- Subscribe
- Mute
- Subscribe to RSS Feed
- Get Direct Link
- Report Inappropriate Content
Bar graphs - Please HELP!
I am trying to make bar graphs in JMP as I've done in Excel (I understand these are very different software with different specialties, but I am learning JMP). See examples of the graphs I want to replicate in JMP, attached. I've dug through many tutorials but have not found the solution.
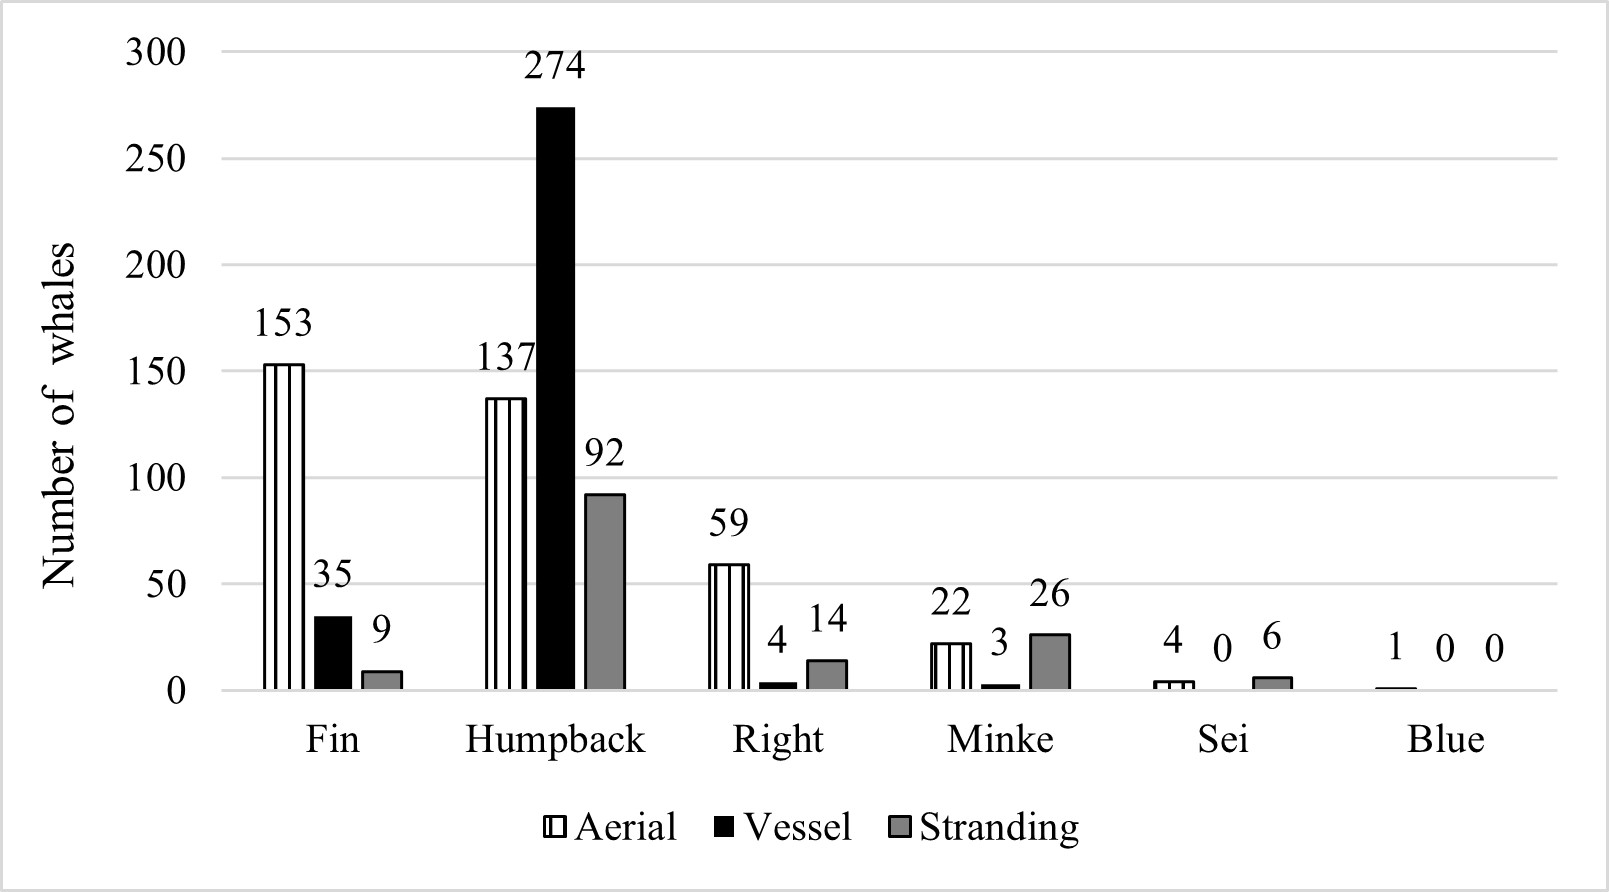
The first graph (see example "Total Number by Platform") is the total number of 6 different species of whales detected from three different platforms (aerial, vessel and stranding records).

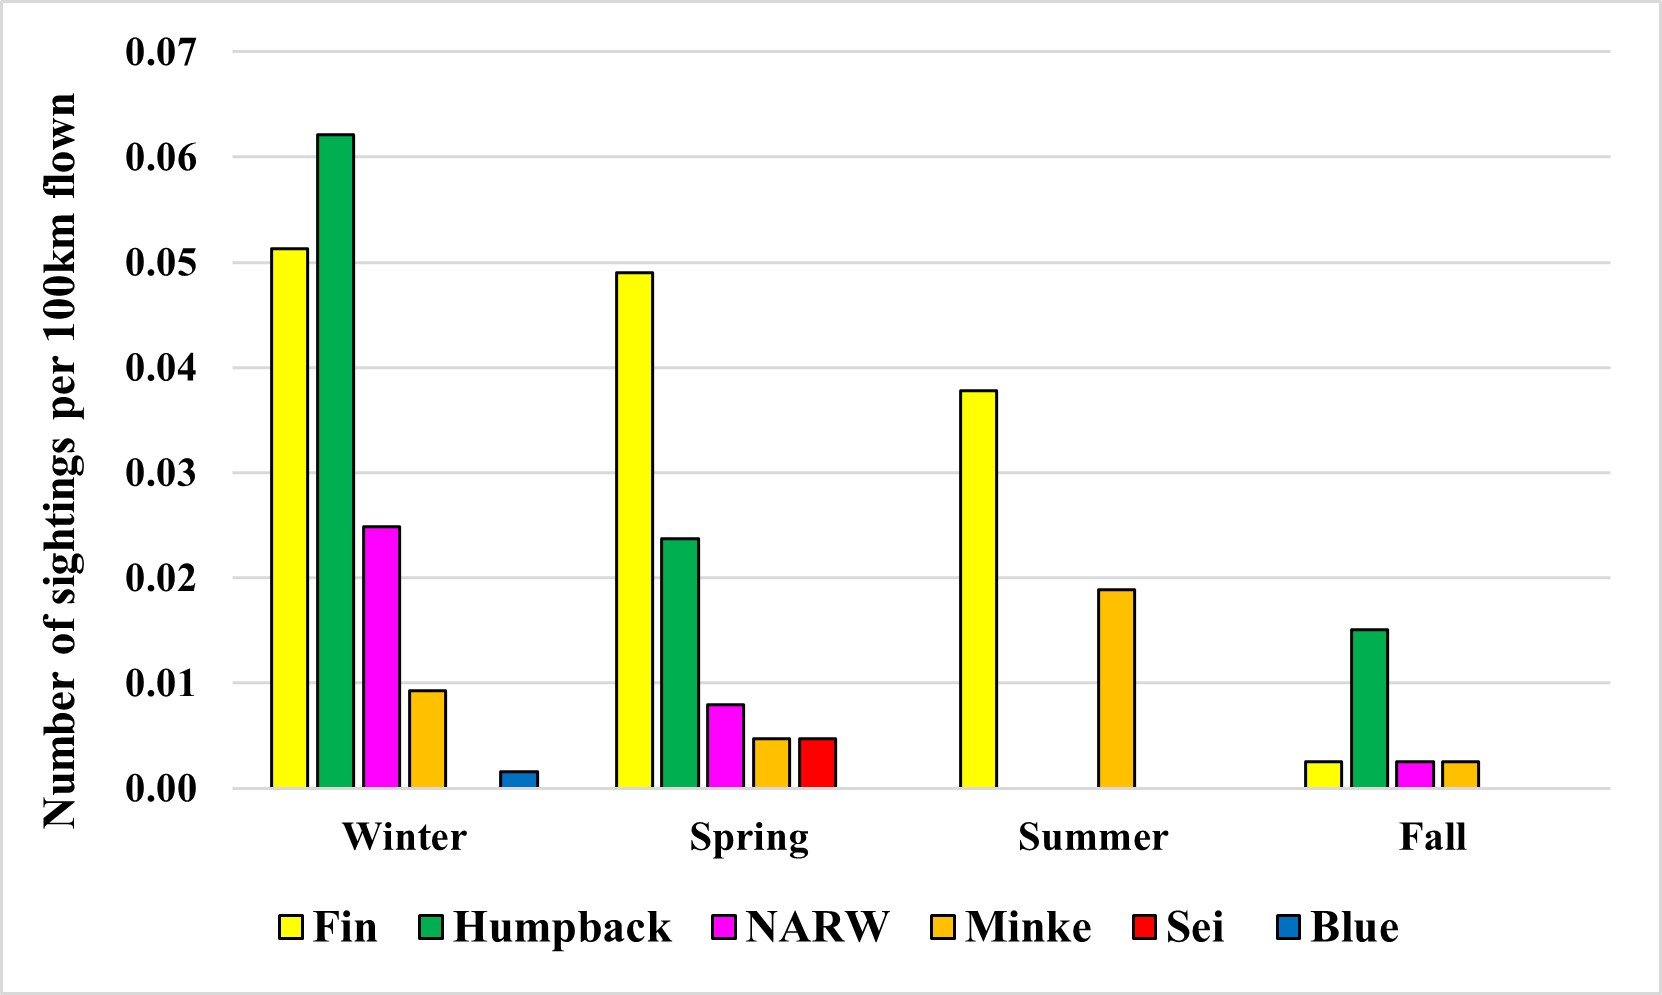
The second graph (see example "Species by season") is the number of whales sighted per 100 km flown by season and for each species.

I've also attached the data in Excel for these two graphs in case anyone can offer guidance. Many thanks in advance! I appreciate your time and help.
Accepted Solutions

- Mark as New
- Bookmark
- Subscribe
- Mute
- Subscribe to RSS Feed
- Get Direct Link
- Report Inappropriate Content
Re: Bar graphs - Please HELP!
Copy your data into a JMP data table like

Open Graph Builder
Select all 6 Whale columns and drag them to the X drop area
Click on the Bar Chart icon
Drag Season to the X axis drop area
Select all of the whale columns
Drag all of them to the Y axis drop area

The same process is used for the Total by Platform spreadsheet
You need to take time to read the document Essential Graphing from the JMP Documentation Library. It is available under the Help pull down menu.
The Graph Builder and all of it's power is documented with examples in the document.
- Mark as New
- Bookmark
- Subscribe
- Mute
- Subscribe to RSS Feed
- Get Direct Link
- Report Inappropriate Content
Re: Bar graphs - Please HELP!
Copy your data into a JMP data table like
Open Graph Builder
Select all 6 Whale columns and drag them to the X drop area
Click on the Bar Chart icon
Drag Season to the X axis drop area
Select all of the whale columns
Drag all of them to the Y axis drop area
The same process is used for the Total by Platform spreadsheet
You need to take time to read the document Essential Graphing from the JMP Documentation Library. It is available under the Help pull down menu.
The Graph Builder and all of it's power is documented with examples in the document.
- Mark as New
- Bookmark
- Subscribe
- Mute
- Subscribe to RSS Feed
- Get Direct Link
- Report Inappropriate Content
Re: Bar graphs - Please HELP!
Thank you so much for your guidance and for your prompt reply to my post. I also very much appreciate the suggestion to refer to the Essential Graphing from the JMP Documentation Library. I am reviewing it today! Thanks again for your time and help!!!
Recommended Articles
- © 2026 JMP Statistical Discovery LLC. All Rights Reserved.
- Terms of Use
- Privacy Statement
- Contact Us