- Sign-in to the JMP Community will be unavailable intermittently Dec. 6-7 due to a system update. Thank you for your understanding!
- We’re retiring the File Exchange at the end of this year. The JMP Marketplace is now your destination for add-ins and extensions.
- JMP 19 is here! Learn more about the new features.
- Subscribe to RSS Feed
- Mark Topic as New
- Mark Topic as Read
- Float this Topic for Current User
- Bookmark
- Subscribe
- Mute
- Printer Friendly Page
Discussions
Solve problems, and share tips and tricks with other JMP users.- JMP User Community
- :
- Discussions
- :
- Bar chart

- Mark as New
- Bookmark
- Subscribe
- Mute
- Subscribe to RSS Feed
- Get Direct Link
- Report Inappropriate Content
Bar chart
Here is the data structure (Test.jmp) and result picture from the platform "Fit Y by X" (Test.jpg). JMP 14

I would like to get the same picture, but with the SEPARATION bars (statistical analysis does not interest).
Accepted Solutions

- Mark as New
- Bookmark
- Subscribe
- Mute
- Subscribe to RSS Feed
- Get Direct Link
- Report Inappropriate Content
Re: Bar chart
So, like this (made with Graph Builder):

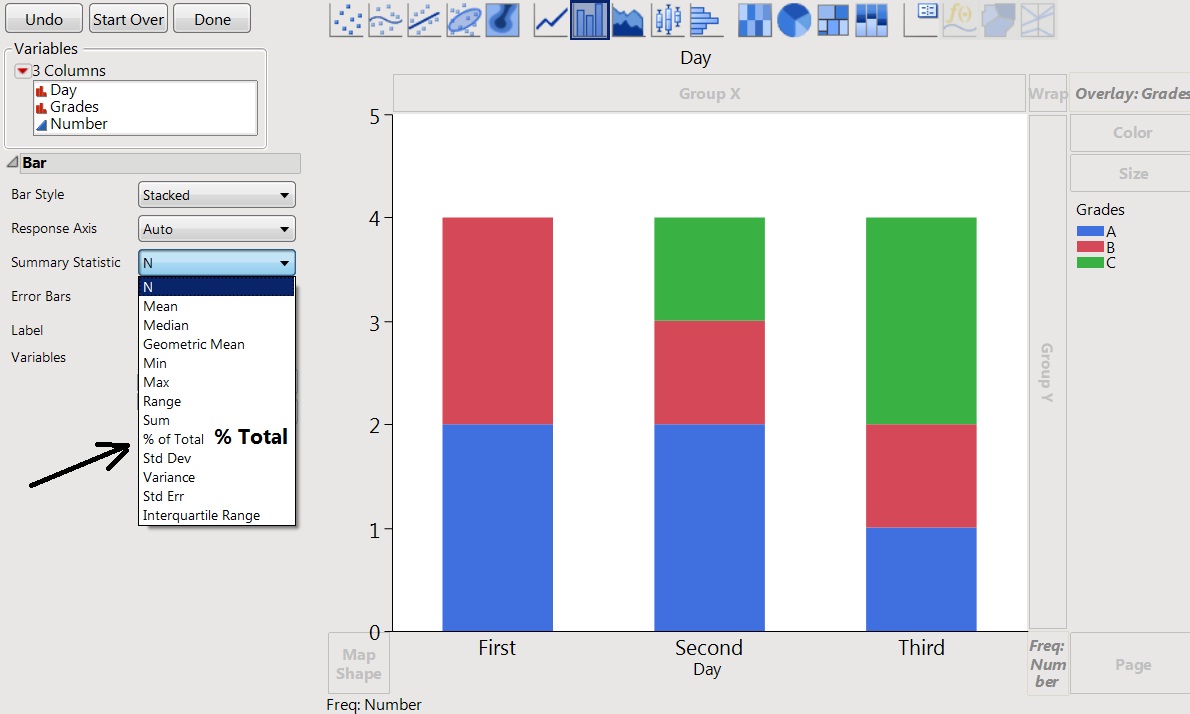
I left all of the options on so that you can see how this was created. Day on the X-axis. Grades went into an overlay. Number goes into the Frequency role. Used the bar chart graphing element. Bar style is stacked with % of factor as the summary statistic.
- Mark as New
- Bookmark
- Subscribe
- Mute
- Subscribe to RSS Feed
- Get Direct Link
- Report Inappropriate Content
Re: Bar chart
So, like this (made with Graph Builder):
I left all of the options on so that you can see how this was created. Day on the X-axis. Grades went into an overlay. Number goes into the Frequency role. Used the bar chart graphing element. Bar style is stacked with % of factor as the summary statistic.
- Mark as New
- Bookmark
- Subscribe
- Mute
- Subscribe to RSS Feed
- Get Direct Link
- Report Inappropriate Content
Re: Bar chart
Thank You! How to get the Y-axis exactly like yours? I have not "% factor" (only "% Total")

- Mark as New
- Bookmark
- Subscribe
- Mute
- Subscribe to RSS Feed
- Get Direct Link
- Report Inappropriate Content
Re: Bar chart
I'm sorry. The % of Factor is a version 15 feature. I forgot that it is not available in version 14. So, to get this in version 14, you will need to add a column to your data table with this formula:
:Number / Col Sum( :Number, :Day )
You will then use this new column as the Y-variable. If you choose the Percent format for this column, the bar chart should look like you want.
Recommended Articles
- © 2025 JMP Statistical Discovery LLC. All Rights Reserved.
- Terms of Use
- Privacy Statement
- Contact Us