- New to JMP? Join us Sept. 23-24 for the Early User Edition of Discovery Summit, tailor-made for new users. Register now for free!
- Use World Cup data to build models, explore spatial relationships, and create informative visualizations in JMP. Register. July 17, 2 pm US Eastern Time.
- Your voice matters! Tell us how you prefer to receive JMP updates, so we can tailor our communication to your needs. Take short survey.
- Subscribe to RSS Feed
- Mark Topic as New
- Mark Topic as Read
- Float this Topic for Current User
- Bookmark
- Subscribe
- Mute
- Printer Friendly Page
Discussions
Solve problems, and share tips and tricks with other JMP users.- JMP User Community
- :
- Discussions
- :
- Re: Bar Graph - Stacking Multiple Columns with Discrete Categories

- Mark as New
- Bookmark
- Subscribe
- Mute
- Subscribe to RSS Feed
- Get Direct Link
- Report Inappropriate Content
Bar Graph - Stacking Multiple Columns with Discrete Categories
I'm trying to determine RFT of parts based on the value against spec limits. I've been able to create custom transform columns in the graph builder using the following JSL script:
vars = expr(Variables());
dataSheet = "....CENSORED.jmp";
dt = Open(dataSheet);
colnames = dt << get column group( "Data" );
For( i = 1, i <= nitems(colnames), i++,
colName = Char(colnames[i]);
insert into(vars,
eval expr(
X(
Transform Column(
expr(char(colName)),
Character,
Nominal,
Formula(
lsl = (expr(parse(colName)) << get property( "Spec Limits" ))["LSL"];
usl = (expr(parse(colName)) << get property( "Spec Limits" ))["USL"];
If( expr(parse(colName)) < lsl | expr(parse(colName)) > usl,
"Bad",
"Good"
);
)
)
)
)
);
);
gb = Eval Expr(
Graph Builder(
Show Control Panel( 1 ),
Expr( Name Expr( vars ) )
)
);
for(j = 1, j <= nitems(colNames), j++,
insert into(gb,
eval expr(
Elements(
Position( expr(j), 1 ),
Bar(
X,
Legend( 3 ),
Bar Style( "Stacked" ),
Summary Statistic( "% of Total" )
)
)
)
);
);
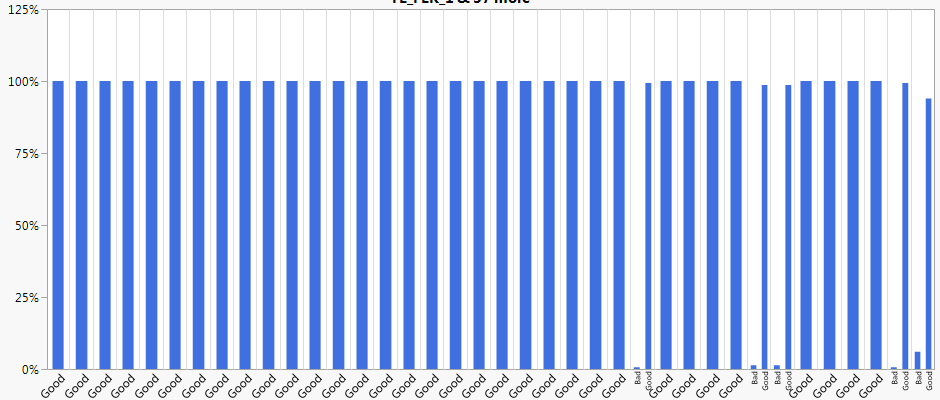
gb;This produces a virtual column for each column in the table with "Good" or "Bad" depending whether that feature was outside the spec limits. The problem is when I plot this using the Bar Chart I can't get the columns to stack:

What I'd like to see is something like this:

I can't see a way of doing this without losing connection to the original data table (ie, creating a summary style table that calculates the good/bad percentage separately)!
Help!

- Mark as New
- Bookmark
- Subscribe
- Mute
- Subscribe to RSS Feed
- Get Direct Link
- Report Inappropriate Content
Re: Bar Graph - Stacking Multiple Columns with Discrete Categories
Have you tried a mosaic plot?
- Mark as New
- Bookmark
- Subscribe
- Mute
- Subscribe to RSS Feed
- Get Direct Link
- Report Inappropriate Content
Re: Bar Graph - Stacking Multiple Columns with Discrete Categories
Unfortunately the Mosaic function doesn't work either:

- Mark as New
- Bookmark
- Subscribe
- Mute
- Subscribe to RSS Feed
- Get Direct Link
- Report Inappropriate Content
Re: Bar Graph - Stacking Multiple Columns with Discrete Categories

So Mosaic might work, as demonstrated with this test data, but the direction of the bars in incorrect. There's no option to change this direction that I can see of
- Mark as New
- Bookmark
- Subscribe
- Mute
- Subscribe to RSS Feed
- Get Direct Link
- Report Inappropriate Content
Re: Bar Graph - Stacking Multiple Columns with Discrete Categories
You need to get your data into the correct format. I'm guessing you want a separate bar for FT1 and FT2, right? You need to stack those columns (Tables > Stack). Almost everything in JMP needs to be in long format. I started with your table from the screen shot and produced this:

Recommended Articles
- © 2026 JMP Statistical Discovery LLC. All Rights Reserved.
- Terms of Use
- Privacy Statement
- Contact Us