- Subscribe to RSS Feed
- Mark Topic as New
- Mark Topic as Read
- Float this Topic for Current User
- Bookmark
- Subscribe
- Mute
- Printer Friendly Page
Discussions
Solve problems, and share tips and tricks with other JMP users.- JMP User Community
- :
- Discussions
- :
- Analysis using data from specific rows and columns
- Mark as New
- Bookmark
- Subscribe
- Mute
- Subscribe to RSS Feed
- Get Direct Link
- Report Inappropriate Content
Analysis using data from specific rows and columns
Hi all,
I have data for some batches and each batch has different streams(so in each row I have different parameters for a specific stream in a batch). I want to find parameters affecting, say yield, of a specific stream in all batches. It seems that this task is not straight forward. One way that my friend (@ressel) showed was extracting data for that specific stream using Data Filter in a new table and then do the job. Anyone else has an idea?
Just to be sure that I have described what I want, here is an illustration of my data in the tables
P1 P2 P3 P4 Y
B1 S1 x x x x x
B1 S2 x x x x x
B1 S3 - - - - x
B2 S1 x x x x -
B2 S2 x x x x x
B2 S3 - - - - x
What I'm looking for here, is to see the effect of P1s in S1s and P2s in S2s on Ys in S3s. Here, if I select S1s and S2s, I will get the Ys that I'm not interested in, if I select S3s, I will not have access to the P1s and P2s in the location that I want.
PS: I added a sample file for what I'm looking for: Evaluate the effect of milling time in streams 1, 3 and 5 and also washing time in streams 2 and 4 on Protein Yield in Streams 8 and make a model and calculate its parameters and their significance
- Mark as New
- Bookmark
- Subscribe
- Mute
- Subscribe to RSS Feed
- Get Direct Link
- Report Inappropriate Content
Re: Analysis using data from specific rows and columns
I'm not sure I understand exactly what you want to do. As I understand it, the P1, P2, P3, and P4 are process variables. I assume there is an actual response (Y) also in the data table. Process variables affect the response. You want to measure the effect of the process variables for each batch and/or stream.
If you are using a data filter, you do not need to create a new table. But a combination of data filter and column switcher should do the trick.
Perform your analysis on ALL of the data (all batches and all streams) for a Y and one of the P's. Let's say P1. From the red triangle add a local filter for Batch and Stream. You can now choose which batch and stream combination you want for this analysis. Now go back to the red triangle and add a Column Switcher. Specify P1 as the column to switch out, specify P1 through P4 as possible columns to switch to. Now you can specify which Batch, Stream, and P1-P4 you wish for any analysis.
- Mark as New
- Bookmark
- Subscribe
- Mute
- Subscribe to RSS Feed
- Get Direct Link
- Report Inappropriate Content
Re: Analysis using data from specific rows and columns
Thanks for your reply, Dan. I changed my table and the text after that, to make it a bit clearer. I tried to do what you said, but when I add the filter I can't find the Column Switcher that you are referring to. Also, when I add the filter, I don't get any point on the plots, since I don't have any reading for P1s at those S3s.
Also, I added a sample file with a description of what I'm looking for.
- Mark as New
- Bookmark
- Subscribe
- Mute
- Subscribe to RSS Feed
- Get Direct Link
- Report Inappropriate Content
Re: Analysis using data from specific rows and columns
I am a little confused on why you would want to do so many subset analyses. It is often better to fit a single model using Batch, Stream, P1, P2, P3, and P4 as inputs to see how they impact Y. JMP will automatically ignore rows with missing values. One analysis using all available data. That is typically the best approach.
It sounds like you want to have Y=f(P1) for S1. Y=f(P2) for S2, etc. I think these steps will meet your request, if I understand it properly. To illustrate I made up some data that matches your example, and I have attached it with a script for the analysis.
Choose Analyze > Fit Y by X.
Specify Y as Y. Choose P1 as the X.
From the Bivariate Fit red triangle, choose Fit Line (I assume this is the analysis you wish to perform).
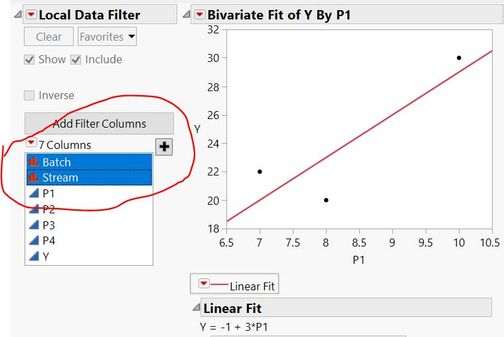
Go back to the Bivariate Fit red triangle and choose Local Data Filter.
Under the Local Data Filter section, highlight Batch and Stream, and click the "+".
You can now choose any Batch and Stream combination and JMP will update the analysis for that subgroup. Note that using the six rows you mocked up in your original post, you will not have enough data to perform regression for many of the subsets. So, I hope you have more data than your mockup.
Now, to switch the P1 to a different P# column, do this.
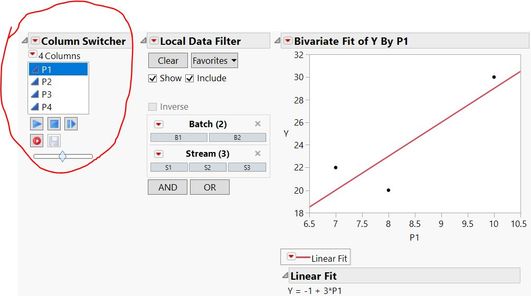
Go back to the BIVARIATE red triangle and choose Redo > Column Switcher.
In the dialog that appears, select P1 and click OK.
In the next dialog, select P1 through P4 and click OK.
Clicking on a different P# will automatically switch the X-axis on the analysis.
I do believe this will give you what you requested, but I would encourage you to consider a single analysis rather than multiple analyses and this "subsetting" of the data.
- Mark as New
- Bookmark
- Subscribe
- Mute
- Subscribe to RSS Feed
- Get Direct Link
- Report Inappropriate Content
Re: Analysis using data from specific rows and columns
@Hamid, didn't see the shout-out, so missed your initial post. Can you see this one? Hope yesterday's session was useful for you. Have a good day.
Recommended Articles
- © 2026 JMP Statistical Discovery LLC. All Rights Reserved.
- Terms of Use
- Privacy Statement
- Contact Us


