- Subscribe to RSS Feed
- Mark Topic as New
- Mark Topic as Read
- Float this Topic for Current User
- Bookmark
- Subscribe
- Mute
- Printer Friendly Page
Discussions
Solve problems, and share tips and tricks with other JMP users.- JMP User Community
- :
- Discussions
- :
- Re: Analysis of means (ANOM) decision limits for log transformed data glitch [fi...
- Mark as New
- Bookmark
- Subscribe
- Mute
- Subscribe to RSS Feed
- Get Direct Link
- Report Inappropriate Content
Analysis of means (ANOM) decision limits for log transformed data glitch [fit curve]
Hello,
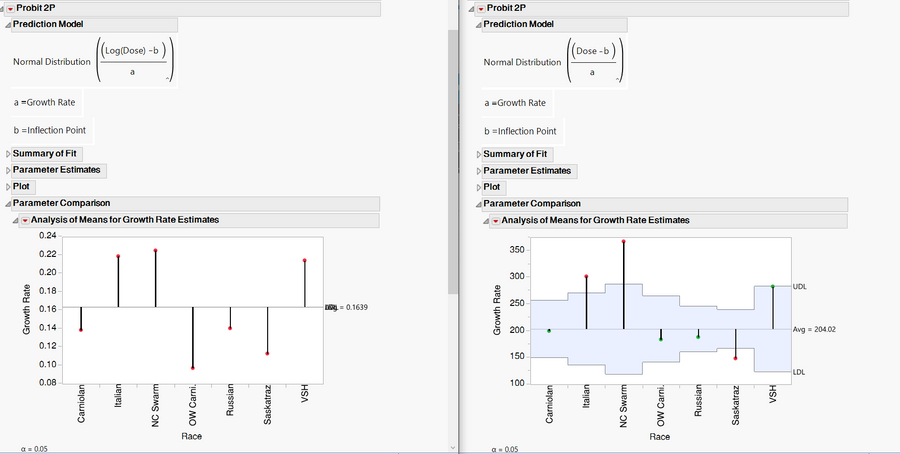
I am doing some fit curve work on log transformed mortality data using 2 parameter probit and am super confused as to why the upper and lower limits are the same value for this log transformed dataset when comparing using an ANOM:
When I run this on the same data untransformed I get appropriate limits for a comparison. is this a glitch or am I doing something wrong?
Kind regards,
Joe
- Mark as New
- Bookmark
- Subscribe
- Mute
- Subscribe to RSS Feed
- Get Direct Link
- Report Inappropriate Content
Re: Analysis of means (ANOM) decision limits for log transformed data glitch [fit curve]
It is possible that there is an error. I do not have your data so I cannot confirm your observation.
I used weight and height in Big Class data table to fit a Exponential 2P model for each age. I compared the estimates:
I applied the Log() function to the weight and repeated my analysis:
The transformation changed the scale and shape as expected. My simple trial does not seem to replicate the problem that you see.
Can you show us the same plot as below for the fits to your data using the original response and the transformed response?
- Mark as New
- Bookmark
- Subscribe
- Mute
- Subscribe to RSS Feed
- Get Direct Link
- Report Inappropriate Content
Re: Analysis of means (ANOM) decision limits for log transformed data glitch [fit curve]
Here is the side by side. I am comparing a dose response, so the dose needs to be log transformed (standard practice). To give you some background. I am trying to compare the ld50's between GLM-Binomial-Probit vs running Probit 2P on the ratio vs. Dose.
I appreciate any suggestions you may have.
- Mark as New
- Bookmark
- Subscribe
- Mute
- Subscribe to RSS Feed
- Get Direct Link
- Report Inappropriate Content
Re: Analysis of means (ANOM) decision limits for log transformed data glitch [fit curve]
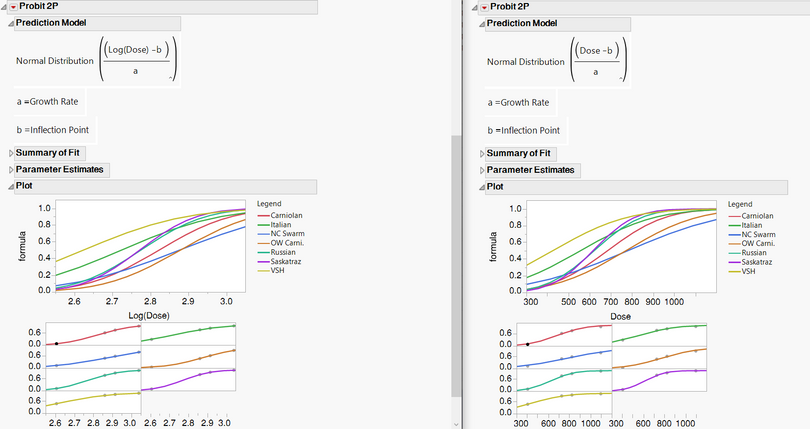
Thanks, those plots are helpful. They clearly show the discrepency in the decision limits! But I wonder if you could show the same plots as I gave above with the standard curve data and fits (overlaid and individual)?
We might be able to solve your problem without going to JMP Technical Support.
- Mark as New
- Bookmark
- Subscribe
- Mute
- Subscribe to RSS Feed
- Get Direct Link
- Report Inappropriate Content
Re: Analysis of means (ANOM) decision limits for log transformed data glitch [fit curve]
Below is the formula I am using as the Y. It is the prediction formula generated by the GLM analysis
- Mark as New
- Bookmark
- Subscribe
- Mute
- Subscribe to RSS Feed
- Get Direct Link
- Report Inappropriate Content
Re: Analysis of means (ANOM) decision limits for log transformed data glitch [fit curve]
I do not see any obvious problem with either the data or the model. I would report this issue to JMP Technical Support (support@jmp.com).
Please report back with your findings!
Recommended Articles
- © 2026 JMP Statistical Discovery LLC. All Rights Reserved.
- Terms of Use
- Privacy Statement
- Contact Us


