- Learn how to build custom Python data connectors and further customize JMP’s Data Connector Framework with the Python Data Connector Demo, available now in the JMP Marketplace!
- See how to create experiments to support product design and ID useful product features. Register for June 12 webinar, 2pm US Eastern Time.
- Subscribe to RSS Feed
- Mark Topic as New
- Mark Topic as Read
- Float this Topic for Current User
- Bookmark
- Subscribe
- Mute
- Printer Friendly Page
Discussions
Solve problems, and share tips and tricks with other JMP users.- JMP User Community
- :
- Discussions
- :
- Re: Analysis of Combined Experiments

- Mark as New
- Bookmark
- Subscribe
- Mute
- Subscribe to RSS Feed
- Get Direct Link
- Report Inappropriate Content
Analysis of Combined Experiments
Hello, I am a graduate student doing agricultural research in physical weed control. My question is, how to properly test for year effects between experiments in JMP Pro 16.0.0 (macOS)?
I have designed a full factorial completely randomized block design experiment that tests the effects tool angle and spacing on efficacy (proportion of weeds killed). Each experiment consists of four blocks, three tool angles, and three tool spacings. This experiment was replicated in 2021 and 2022 in different fields (on the same farm).
The model I have built is shown below:
Year (random effect)
Block[Year] (random effect)
Year*Tool Angle (random effect)
Year*Tool Spacing (random effect)
Year*Tool Angle*Tool Spacing (random effect)
Tool Angle (fixed effect)
Tool Spacing (fixed effect)
Tool Angle*Tool Spacing (fixed effect)
I have been told this is correct. I have seen this model in journal articles, but I have also seen other models used by students/researchers. Other models show a tool angle effect, but the model above shows no tool angle effect. I am confused as to which is correct. When I save residuals in JMP are they the residuals from Year*Tool Angle*Tool Spacing (random effect)?
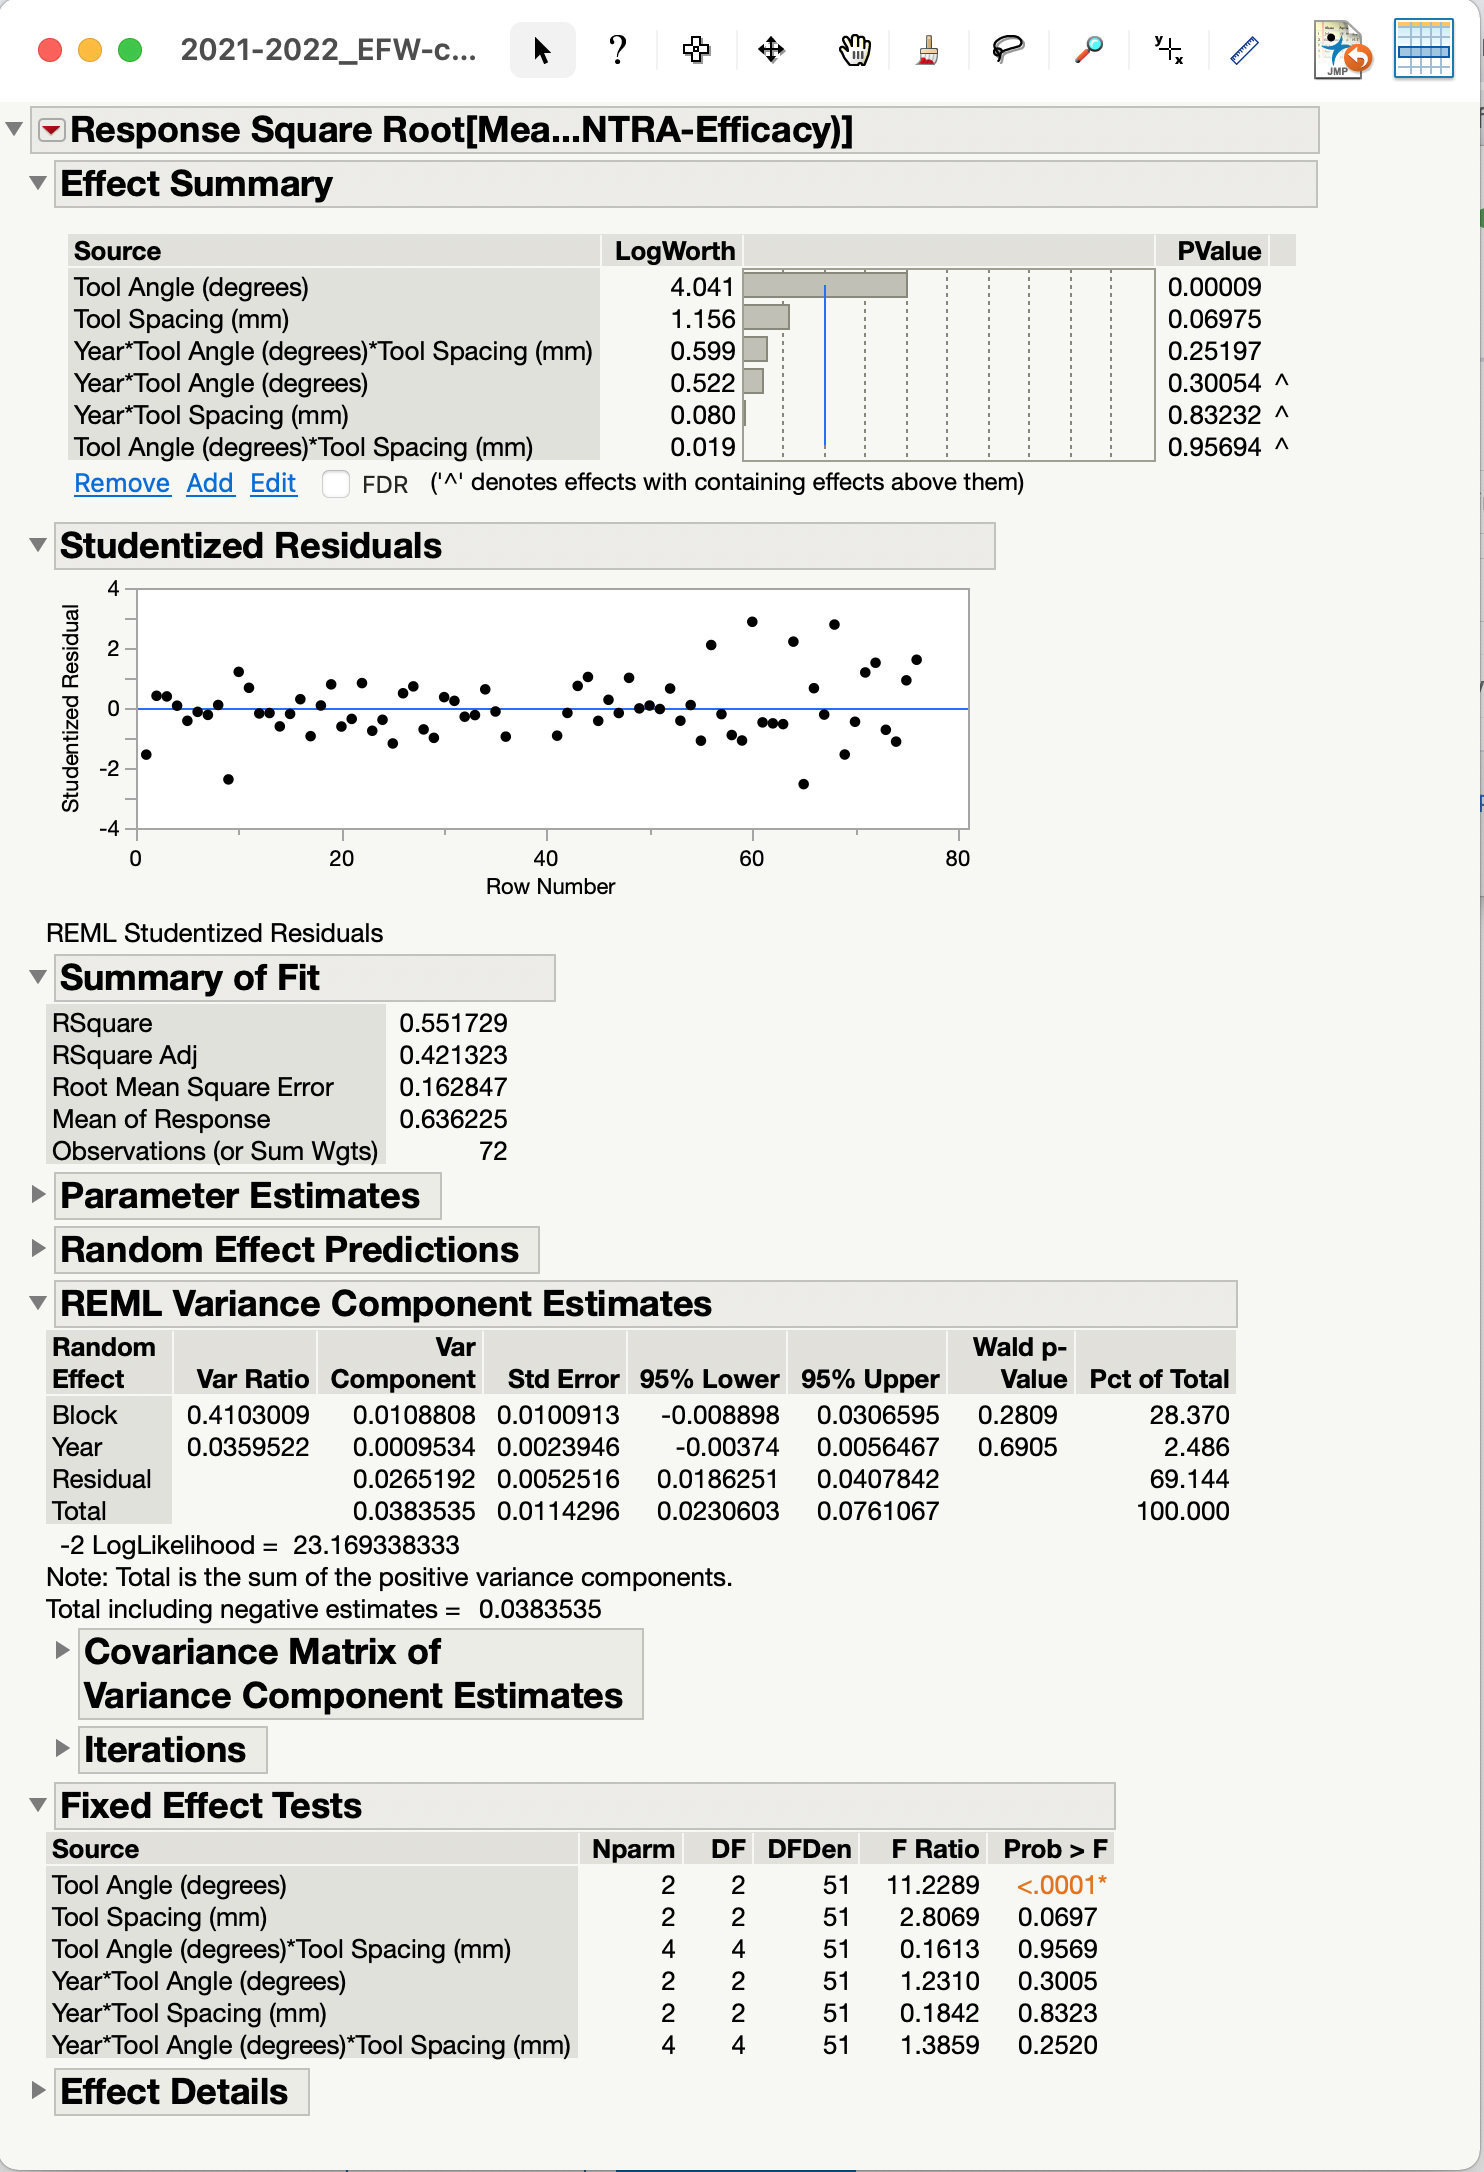
My other question is, what does it mean when the Wald p-Value is not significant (for a random effect in the REML Variance Component Estimates table), but when you conduct a Students t-test within the Effect Details Tab, the experiments are statistically different from each other?
Any thoughts are appreciated.
Accepted Solutions

- Mark as New
- Bookmark
- Subscribe
- Mute
- Subscribe to RSS Feed
- Get Direct Link
- Report Inappropriate Content
Re: Analysis of Combined Experiments
The difference between option 1 and option 2 is that you first included interaction terms with Year for random effects, but you did not include these interactions in the second model. The second model provides many more degrees of freedom (DF) for the fixed effect, so the F-ratio is more sensitive in the second analysis.
I should comment that while it is correct to model some of the effects as random, you have such small replication for these factors that the estimation is quite poor. (Two years, four blocks) It is done correctly but with great uncertainty in the estimate.
Sometimes we view an experiment as a set of fixed hypothesis tests. Other times we view it as a chance to explore with the model to learn what might be happening. The second view would start with an extreme model (all terms out except intercept out or all terms in) and then work in the opposite direction. You might use option 2 and remove one term at a time, always selecting the least significant (highest p-value) term and removing it. Fully examine the resulting analysis at each step.
It sounds like you might have had hypotheses at the start of your experiment. How do those expectations line up with the findings in the analysis? What results surprised you?
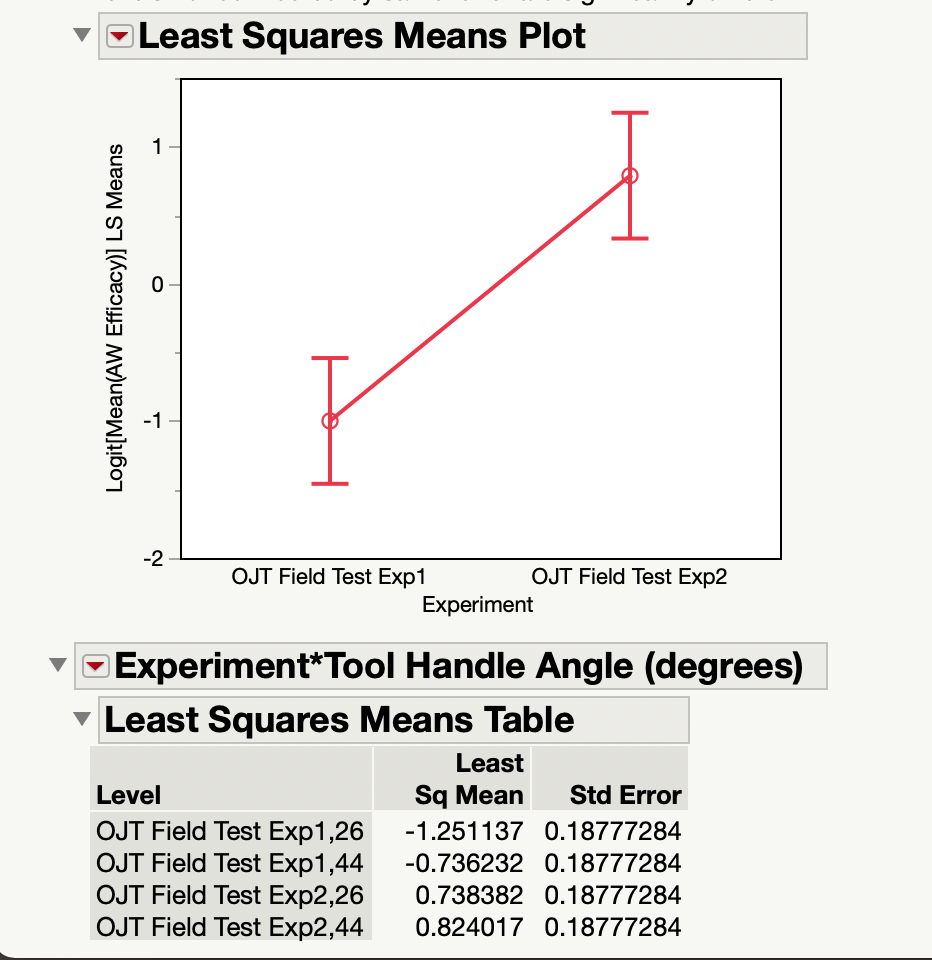
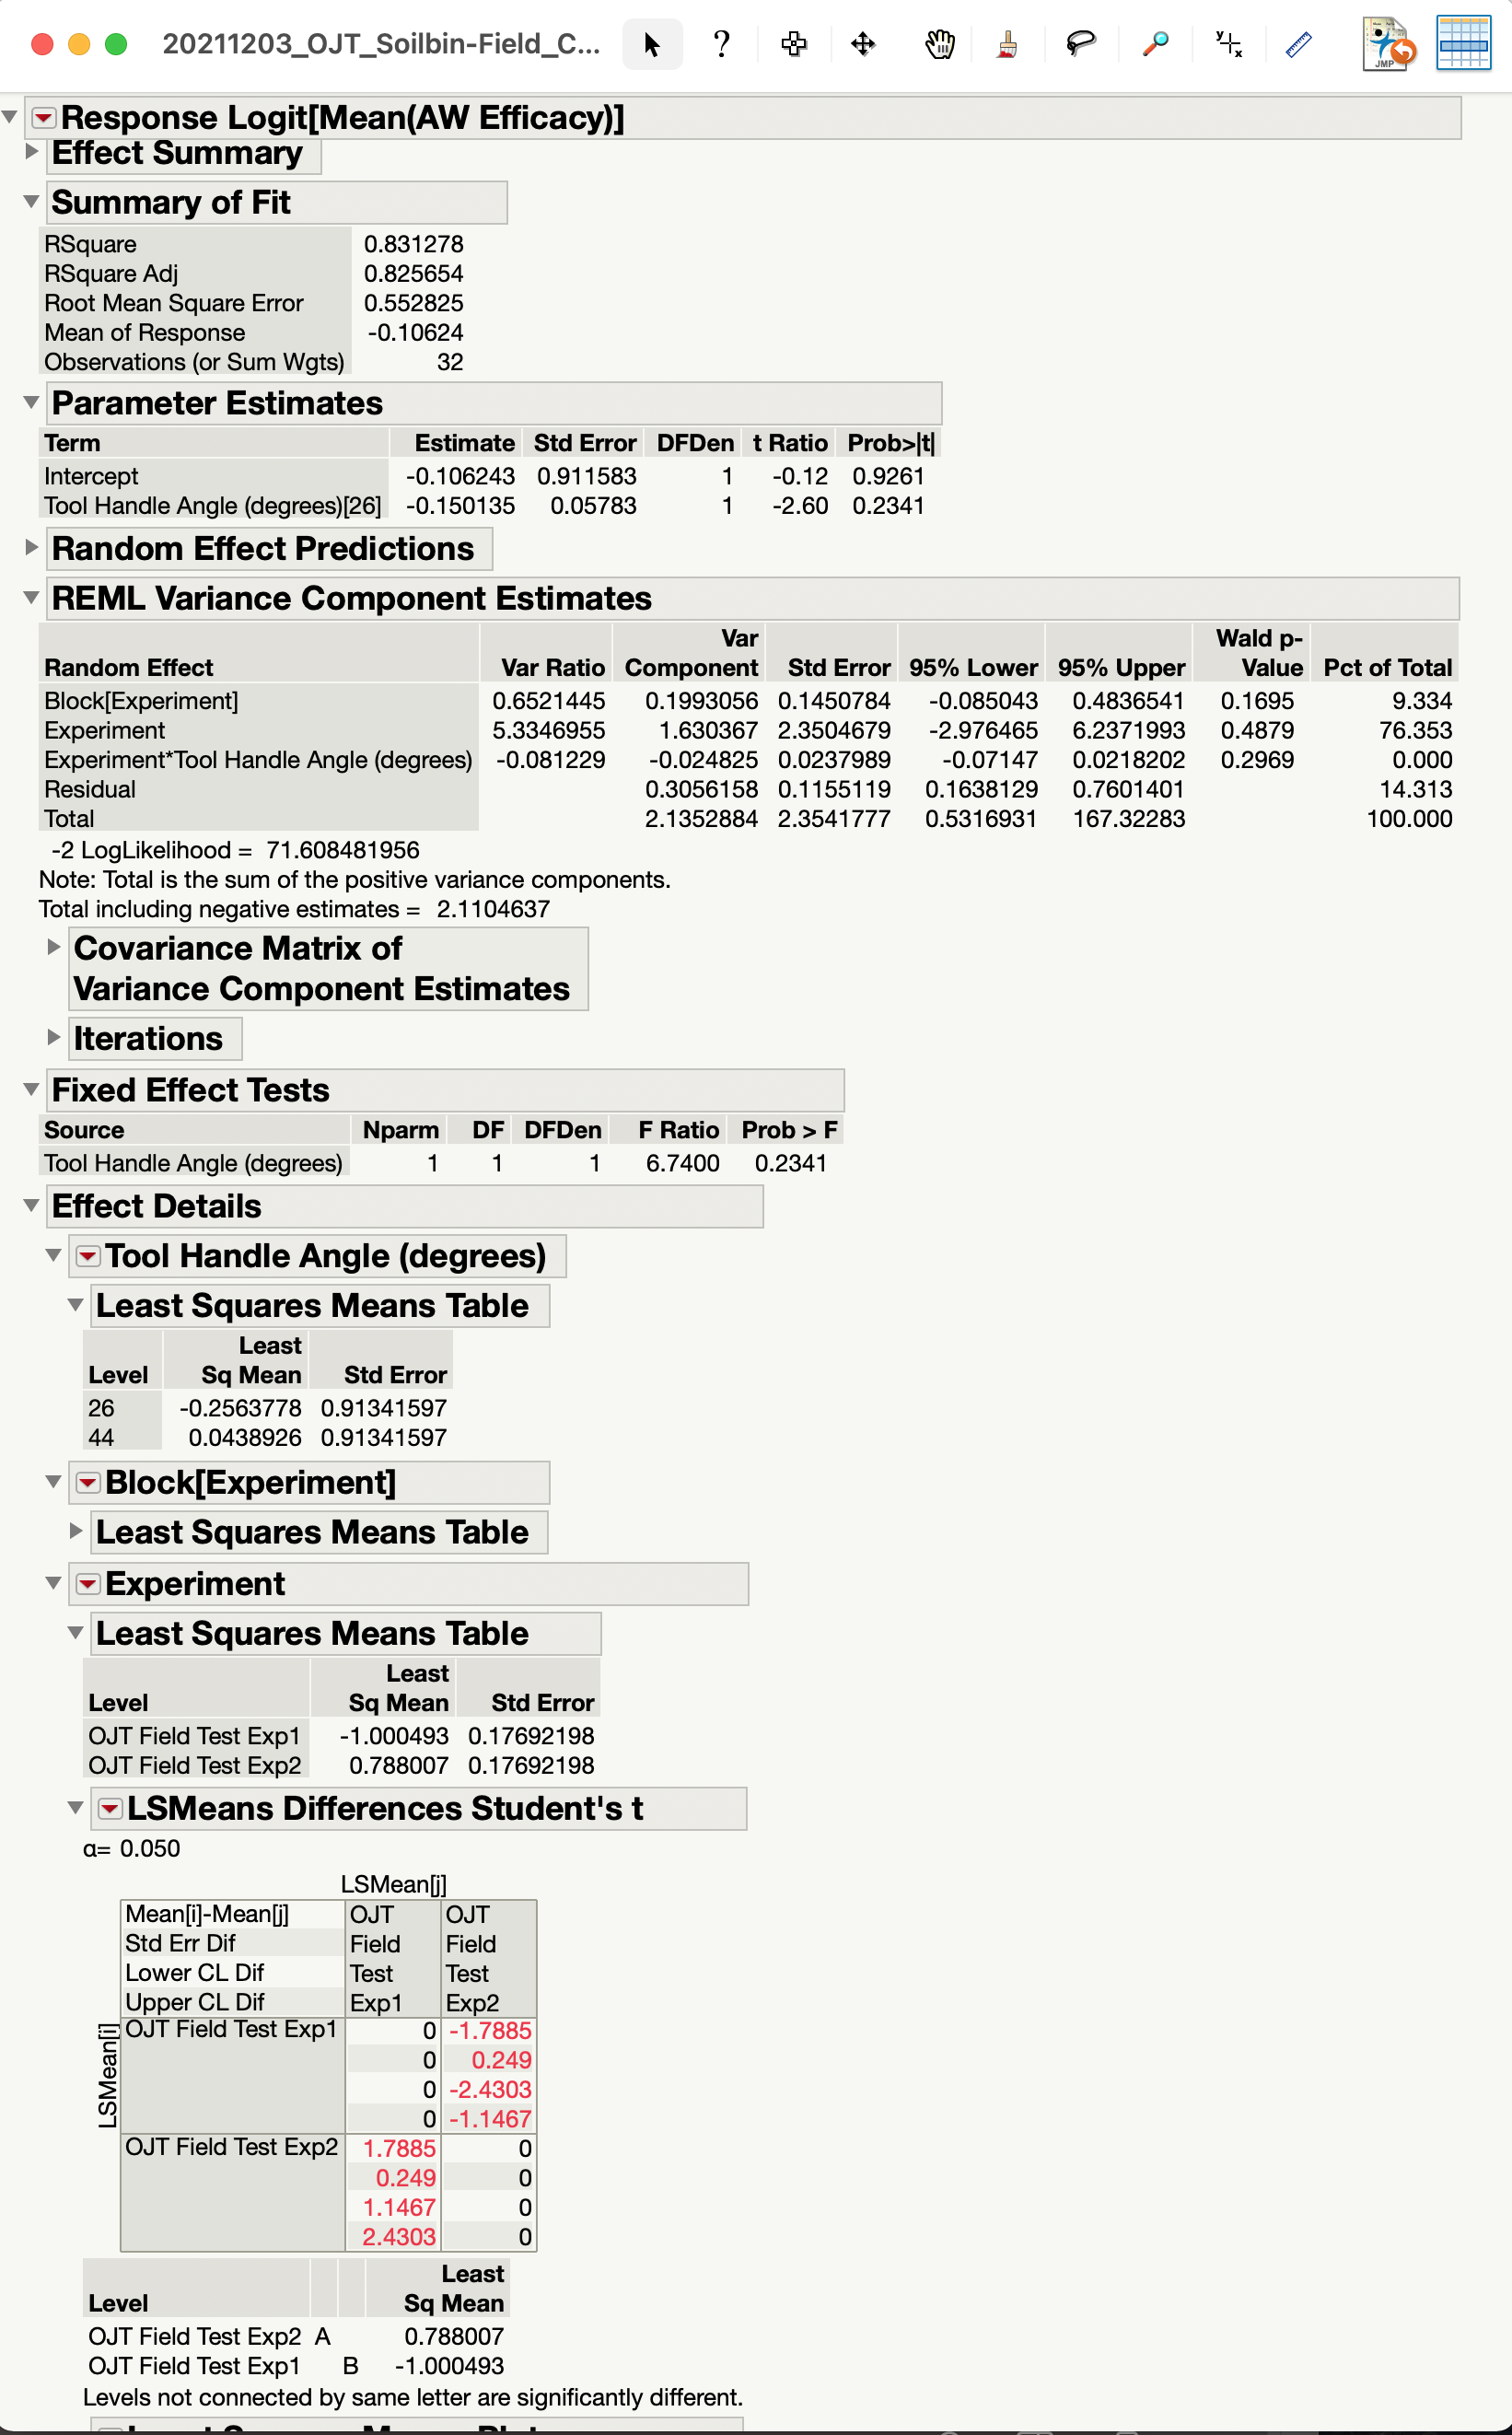
Regarding the second experiment, I would treat the Experiment as a fixed effect for this test. You only have two levels. so testing a difference by variance will unlikely find all but huge changes. You can use the Effect Tests table to decide if it is significant as a fixed effect.
- Mark as New
- Bookmark
- Subscribe
- Mute
- Subscribe to RSS Feed
- Get Direct Link
- Report Inappropriate Content
Re: Analysis of Combined Experiments
Your model includes a term for the fixed effect of tool angle. It is third from the bottom of the list above.
The Wald test is for a variance estimate different from zero. The effect test is an F-test for a parameter estimate different from zero. Would you please post a picture of the Fit Least Squares window st we can see the REML outliner and the Effect Test outline?
- Mark as New
- Bookmark
- Subscribe
- Mute
- Subscribe to RSS Feed
- Get Direct Link
- Report Inappropriate Content
Re: Analysis of Combined Experiments
Hi Mark,
For my first question I should have specified, I meant that I see a significant effect in tool angle (P < 0.0001) when using "Option2" and no significant effect in tool angle (P = 0.0988) when using "Option1." It seems like there are so many terms in Option1, I am losing my ability to detect the tool angle effect on efficacy.
My second question is for another experiment. I have attached some photos below. I want to test if the two field experiments are statistically different from each other.
- Mark as New
- Bookmark
- Subscribe
- Mute
- Subscribe to RSS Feed
- Get Direct Link
- Report Inappropriate Content
Re: Analysis of Combined Experiments
The difference between option 1 and option 2 is that you first included interaction terms with Year for random effects, but you did not include these interactions in the second model. The second model provides many more degrees of freedom (DF) for the fixed effect, so the F-ratio is more sensitive in the second analysis.
I should comment that while it is correct to model some of the effects as random, you have such small replication for these factors that the estimation is quite poor. (Two years, four blocks) It is done correctly but with great uncertainty in the estimate.
Sometimes we view an experiment as a set of fixed hypothesis tests. Other times we view it as a chance to explore with the model to learn what might be happening. The second view would start with an extreme model (all terms out except intercept out or all terms in) and then work in the opposite direction. You might use option 2 and remove one term at a time, always selecting the least significant (highest p-value) term and removing it. Fully examine the resulting analysis at each step.
It sounds like you might have had hypotheses at the start of your experiment. How do those expectations line up with the findings in the analysis? What results surprised you?
Regarding the second experiment, I would treat the Experiment as a fixed effect for this test. You only have two levels. so testing a difference by variance will unlikely find all but huge changes. You can use the Effect Tests table to decide if it is significant as a fixed effect.
- Mark as New
- Bookmark
- Subscribe
- Mute
- Subscribe to RSS Feed
- Get Direct Link
- Report Inappropriate Content
Re: Analysis of Combined Experiments
Thank you for your input on this, it helps a lot. It makes sense that the estimation is poor. With these large experiments you run out of space and labor quickly. It is certainly hard to detect minor differences.
I hypothesized that a "hilling" tool angle setting would cause higher weed mortality and that tool spacing would increase in aggressiveness the closer the tools got to each other. Taking away some of the least significant terms in the model I can see that hilling caused higher weed mortality, but I was very surprised not to see a significant tool spacing effect. That was quite interesting to me.
Thank you for your thoughts on the second experiment as well.
Recommended Articles
- © 2026 JMP Statistical Discovery LLC. All Rights Reserved.
- Terms of Use
- Privacy Statement
- Contact Us