- Subscribe to RSS Feed
- Mark Topic as New
- Mark Topic as Read
- Float this Topic for Current User
- Bookmark
- Subscribe
- Mute
- Printer Friendly Page
Discussions
Solve problems, and share tips and tricks with other JMP users.- JMP User Community
- :
- Discussions
- :
- Analysis DoE result from two different equipment

- Mark as New
- Bookmark
- Subscribe
- Mute
- Subscribe to RSS Feed
- Get Direct Link
- Report Inappropriate Content
Analysis DoE result from two different equipment
I have two experiment result sets from two different equipment using same DoE design.
Two equipments have same function, structure and perpose, only different in scale.
I would like to show the equibalence betweent two result from two equipment.
I tried to perform TOST, but there was a gap between two result which seems to come from scale difference.
In my experience, the equipment B generally show lower Y1 and wide variance in all experiment, not only this DoE.
How can I show the equivalence between two result?
- Tags:
- windows

- Mark as New
- Bookmark
- Subscribe
- Mute
- Subscribe to RSS Feed
- Get Direct Link
- Report Inappropriate Content
Re: Analysis DoE result from two different equipment
You do this by looking at location (of the means) and dispersion (of the individual results). There are a couple of ways to do this in JMP, one approach being use of the Fit Y by X platform, using a nominal variable as X (e.g. measurement equipment) and a continuous variable (response from both pieces of equipment).


- Mark as New
- Bookmark
- Subscribe
- Mute
- Subscribe to RSS Feed
- Get Direct Link
- Report Inappropriate Content
Re: Analysis DoE result from two different equipment
Hi @jmpneeeewbie,
If I understood correctly what you would like to do, one possible option for this would be to have two columns of equipment responses, one for each equipment, and then create a calculated column "EquipA - EquipB" (difference between the values of the equipment on which you'll do your equivalence test).
Then, you use this calculated column with the platform "Distribution", and on the red triangle you click on "Test Equivalence". You have to enter Target (here 0 since you don't expect a difference between the two equipments, or +/- a value if equipment B has constantly lower or higher values), a value for a difference you'll consider being practically zero, and the confidence level for this Two One-Sided Test (so if you want a 95% confidence interval in your output, specify a confidence level of 0,975). The default level 0,95 will give you an output with a 90% confidence interval.
See the datatable here in example with the script for equivalence testing.
I hope it will help you,
"It is not unusual for a well-designed experiment to analyze itself" (Box, Hunter and Hunter)
- Mark as New
- Bookmark
- Subscribe
- Mute
- Subscribe to RSS Feed
- Get Direct Link
- Report Inappropriate Content
Re: Analysis DoE result from two different equipment


- Mark as New
- Bookmark
- Subscribe
- Mute
- Subscribe to RSS Feed
- Get Direct Link
- Report Inappropriate Content
Re: Analysis DoE result from two different equipment
I'm not sure I understand what you want or even why you care about equivalence tests? It appears to me you have a RCBD where equipment is confounded with the block. I think the more important question is: Are the results of the DOE consistent over changing pieces of equipment? In this case, I would treat the block effect as a fixed effect and add the main effect and all block-by-factor interactions to the model in doing fit model. You are looking for the block-by factor interactions to be small which would indicate the design factors are robust to the equipment. If there are significant block-by-factor interactions, then the design factor effects are contingent upon which piece of equipment is used. The size of the block effect will be mostly due to equipment. Since this effect can be assigned, you have increased the precision of detecting design factor effects.
- Mark as New
- Bookmark
- Subscribe
- Mute
- Subscribe to RSS Feed
- Get Direct Link
- Report Inappropriate Content
Re: Analysis DoE result from two different equipment
Thanks for your advice, @statman
As like above comment, I did paired T-test and showed two equipment has difference and statistical significance on that difference.
Thus, when I put the equipment as block on the fit model analysis, it has statistical significance.
What I would like two show in this experiment is equipment A is replacable with B for DoE study.
My current plan is to analyze the results from the two equipment respectively to create a design space, and then compare the two design spaces to show the equivalence of DoE performed by the two equipment. Do you think this could have statistical significance?
- Mark as New
- Bookmark
- Subscribe
- Mute
- Subscribe to RSS Feed
- Get Direct Link
- Report Inappropriate Content
Re: Analysis DoE result from two different equipment
If you share your data table, I'm happy to analyze it for you. I think you should do the analysis with all terms in the model and subtract terms from there. Use Daniel plots (Normal plots) to look for statistical significance and Pareto, plots for practical significance.
- Mark as New
- Bookmark
- Subscribe
- Mute
- Subscribe to RSS Feed
- Get Direct Link
- Report Inappropriate Content
Re: Analysis DoE result from two different equipment
@jmpneeeewbie : Perhaps you can simply try to do a Fit Y by X with the responses of equipments A and B (A=Y, B=X since you're trying to replace A with B), to see if you're able to have a simple linear model linking the two measurements responses from the devices ? If you have a good model, that means you're able to "predict" responses from equipment A thanks to responses from equipment B ?
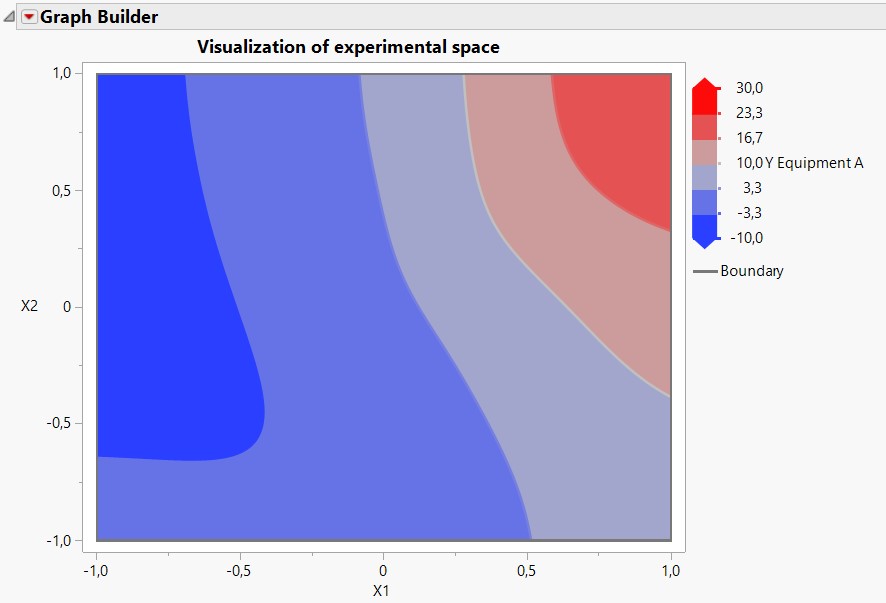
What you can also do is graphically visualize your experimental space with each of the equipment responses, to see if you're able to have the same "map" and optimums. This won't be a statistical test, but it can help to see if you'll have good chances to replace A by B (see captures Experimental space A & B attached).
Both of these options can be seen in the datatable "Equipment_correlation" linked here, with the script "Fit A by B" and "Visualize Experimental Space" for a simple use case (two factors, RSM design).
Without further information or data, it is difficult to help you.
Hope it may help you,
"It is not unusual for a well-designed experiment to analyze itself" (Box, Hunter and Hunter)
Recommended Articles
- © 2026 JMP Statistical Discovery LLC. All Rights Reserved.
- Terms of Use
- Privacy Statement
- Contact Us