- New to JMP? Join us Sept. 23-24 for the Early User Edition of Discovery Summit, tailor-made for new users. Register now for free!
- Your voice matters! Tell us how you prefer to receive JMP updates, so we can tailor our communication to your needs. Take short survey.
- See how to access JMP Marketplace - and - find, create & share add-ins to extend your JMP. Watch video.
- Subscribe to RSS Feed
- Mark Topic as New
- Mark Topic as Read
- Float this Topic for Current User
- Bookmark
- Subscribe
- Mute
- Printer Friendly Page
Discussions
Solve problems, and share tips and tricks with other JMP users.- JMP User Community
- :
- Discussions
- :
- Altering default text of spec limits labels on histograms

- Mark as New
- Bookmark
- Subscribe
- Mute
- Subscribe to RSS Feed
- Get Direct Link
- Report Inappropriate Content
Altering default text of spec limits labels on histograms
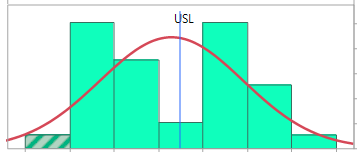
I am trying to figure out whether it is possible to customize the default "LSL" and "USL" labels that appear at the top of the vertical lines that represent the specification limits on histograms in the Distribution platform. I have checked the "Customize..." dialogue, and it seems that only the color of the "Upper Label" item can be changed there. I can also find nothing specifying the label text in the corresponding generated JSL. Help would be appreciated. Please see attached file for an example of the "USL" label.
Accepted Solutions

- Mark as New
- Bookmark
- Subscribe
- Mute
- Subscribe to RSS Feed
- Get Direct Link
- Report Inappropriate Content
Re: Altering default text of spec limits labels on histograms
There is not a way to change the Segment Label for the builtin LSL, Target and USL display for the histogram. However, you can specify to not display any of the spec limits, and then add your own Reference Lines where you can specify any labeling you want. The difference is that the label will be on the axis side of the graph.
Names Default To Here( 1 );
Open( "$SAMPLE_DATA/Big Class.jmp" );
Dis = Distribution(
	Continuous Distribution( Column( :height ),
	Horizontal Layout( 1 ), Vertical( 0 ) ),
	Histograms Only
);
Report( Dis )[Axis Box( 1 )] << Add Ref Line( 55, "Solid", "Black", "Bottom", 1 );
Report( Dis )[Axis Box( 1 )] << Add Ref Line( 67, "Solid", "Black", "Top", 1 );
Report( Dis )[Frame Box( 1 )] << Reference Line Order( 3 );
- Mark as New
- Bookmark
- Subscribe
- Mute
- Subscribe to RSS Feed
- Get Direct Link
- Report Inappropriate Content
Re: Altering default text of spec limits labels on histograms
Thank you for the reply, txnelson.
I am using Spec Limits for KSigma() with a fitted continuous distribution to generate the spec limits. I do want to leave the fitted continuous distribution curve on the histogram, but I do like your suggestion to not display the spec limits. Is there a way to hide the "USL", "LSL", or "Target" text so I may then add reference lines over the spec limit lines that will remain on the histogram?
Assuming there is not, I am now trying to come up with a way to script the unchecking of "Spec Limits" in the red arrow menu so the limit lines and labels will be removed from the histogram, but the distribution curve will remain (if this works, my plan is to pull the limits from "Quantiles: Uncentered and Unscaled" and add reference lines to the histogram).
My attempt:
FDS_rdist["Capability Analysis"] << delete;unfortunately did not work.
Is there a way to send a message using Fit Handle to "unspec" limits and remove the capability analysis?
Thanks again.
- Mark as New
- Bookmark
- Subscribe
- Mute
- Subscribe to RSS Feed
- Get Direct Link
- Report Inappropriate Content
Re: Altering default text of spec limits labels on histograms
You need to familiarize yourself with
Help==>Scripting Index
It will show you what options are available and examples on how to use them.
Below is a simple script that generates the following display

Names Default To Here( 1 );
dt = Open( "$SAMPLE_DATA\semiconductor Capability.jmp" );
dis = Distribution(
	Continuous Distribution( Column( :NPN1 ),
	Horizontal Layout( 1 ),
	Vertical( 0 ) )
);
dis << Capability Analysis( 0 );
specs = dt:npn1 << get property( "spec limits" );
Report( dis )[Axis Box( 1 )] << Add Ref Line( specs["LSL"], "Solid", Black, "The LSL", 1 );
Report( dis )[Axis Box( 1 )] << Add Ref Line( specs["USL"], "Solid", Black, "The USL", 1 );Recommended Articles
- © 2026 JMP Statistical Discovery LLC. All Rights Reserved.
- Terms of Use
- Privacy Statement
- Contact Us