- Don’t miss your chance to experience Discovery Summit Europe at our best available rate! Early bird registration through 31 Oct.
- Graph Builder Toolbar streamlines interactive graphing. Creates shortcuts on Report and GraphBuilder Helpers toolbars. Download and install the extension.
- Subscribe to RSS Feed
- Mark Topic as New
- Mark Topic as Read
- Float this Topic for Current User
- Bookmark
- Subscribe
- Mute
- Printer Friendly Page
Discussions
Solve problems, and share tips and tricks with other JMP users.- User Community
- :
- Discussions
- :
- Re: Add reference line from the reference table

- Mark as New
- Bookmark
- Subscribe
- Mute
- Subscribe to RSS Feed
- Get Direct Link
- Report Inappropriate Content
Add reference line from the reference table
Hi, @txnelson
I am trying to create a variability plot graph and add a reference lines with different values for each of the individual charts. Currently I can plot the reference line but the problem is if the reference table doesn't contain all the test columns from the data table, the script won't work.
Here's what I tried and it works if the reference table has all the tests from the data table:
Names Default To Here( 1 );
Clear Globals();


dt = Open("Data table.jmp"); // Open data table

// Loop to get column name Currents and Voltages
colist = {};
Col_List = dt << Get Column Names( "String" );

	For( q = 1, q <= N Items( Col_List ), q++,

		If( Contains( Col_List[q], "Current" ) | Contains( Col_List[q], "Voltage" ),
			Column( Col_List[q] ) << Set Selected( 1 );
			Insert Into( colist, Col_List[q] );
		)
	);
	// Var Chart
	vc= dt << Variability Chart(
								Y( (Eval( colist )) ),
								X( :Wafer ID ),
								Analysis Type( "Choose best analysis (EMS REML Bayesian)" ),
								Show Range Bars( 0 ),
								Std Dev Chart( 0 ),
								Points Jittered( 1 )

							);
// Reference data table
dt1 = Open ("Reference table.jmp");
xb = Column(dt1, "Reference") << getValues;
// Loop to add reference line to the variability chart
	For( i = 1, i <= N Items( vc ), i++,
		Report( vc[i] )[Framebox( 1 )] << DispatchSeg( CustomStreamSeg( 3 ), {Line Width( 2 )} );
		Report( vc[i] )[AxisBox( 1 )] << {Add Ref Line( xb[i], "Solid", "Green", "RTS", 2 )};
);Accepted Solutions


- Mark as New
- Bookmark
- Subscribe
- Mute
- Subscribe to RSS Feed
- Get Direct Link
- Report Inappropriate Content
Re: Add reference line from the reference table
You could loop over colist and check if dt1 has that specific value with if statement and if it does then add reference line based on value found from dt1. Here is one option using Associative Array (you might have to add scaling to Y-axis for the variability charts, as reference lines can be hidden depending on their value).
Names Default To Here(1);

// dt = Open("Data table.jmp"); // Open data table
// dt1 = Open("Reference table.jmp");

// Loop to get column name Currents and Voltages
colist = {};
Col_List = dt << Get Column Names("String");

For(q = 1, q <= N Items(Col_List), q++,
	If(Contains(Col_List[q], "Current") | Contains(Col_List[q], "Voltage"),
		Column(Col_List[q]) << Set Selected(1);
		Insert Into(colist, Col_List[q]);
	)
);
	// Var Chart
vc = dt << Variability Chart(
	Y((Eval(colist))),
	X(:Wafer ID),
	Analysis Type("Choose best analysis (EMS REML Bayesian)"),
	Show Range Bars(0),
	Std Dev Chart(0),
	Points Jittered(1)
);// Reference data table

aa_refs = Associative Array(dt1:Tests << get values, dt1:Reference << get values);
// Loop to add reference line to the variability chart
For(i = 1, i <= N Items(colist), i++,
	If(Contains(aa_refs, colist[i]),
		Report(vc[i])[Framebox(1)] << DispatchSeg(CustomStreamSeg(3), {Line Width(2)});
		Report(vc[i])[AxisBox(1)] << {Add Ref Line(aa_refs[colist[i]], "Solid", "Green", "RTS", 2)};
	);
);

- Mark as New
- Bookmark
- Subscribe
- Mute
- Subscribe to RSS Feed
- Get Direct Link
- Report Inappropriate Content
Re: Add reference line from the reference table
Here is a slightly different solution, reading the reference table directly
Names Default To Here( 1 );
Clear Globals();


//dt = Open( "Data table.jmp" ); // Open data table
dt = Data Table( "data table" );

// Loop to get column name Currents and Voltages
colist = {};
Col_List = dt << Get Column Names( "String" );

For( q = 1, q <= N Items( Col_List ), q++,

	If( Contains( Col_List[q], "Current" ) | Contains( Col_List[q], "Voltage" ),
		Column( Col_List[q] ) << Set Selected( 1 );
		Insert Into( colist, Col_List[q] );
	)
);
	// Var Chart
vc = dt << Variability Chart(
	Y( (Eval( colist )) ),
	X( :Wafer ID ),
	Analysis Type( "Choose best analysis (EMS REML Bayesian)" ),
	Show Range Bars( 0 ),
	Std Dev Chart( 0 ),
	Points Jittered( 1 )

);// Reference data table
//dt1 = Open( "Reference table.jmp" );
dt1 = Data Table( "reference table" );
xb = Column( dt1, "Reference" ) << getValues;
// Loop to add reference line to the variability chart
For( i = 1, i <= N Items( vc ), i++,
	//Report( vc[i] )[Framebox( 1 )] << DispatchSeg( CustomStreamSeg( 3 ), {Line Width( 2 )} );
	testVal = Word( -2, Report( vc[i] )[Outline Box( 2 )] << get title, " " ) || " " || Word(
		-1,
		Report( vc[i] )[Outline Box( 2 )] << get title,
		" "
	);
	testRow = dt1 << get rows where( :tests == testVal );
	If( N Rows( testRow ) > 0,
		Report( vc[i] )[AxisBox( 1 )] << Add Ref Line( dt1:Reference[testRow[1]], "Solid", "Green", "RTS", 2 )
	);
);- Mark as New
- Bookmark
- Subscribe
- Mute
- Subscribe to RSS Feed
- Get Direct Link
- Report Inappropriate Content
Re: Add reference line from the reference table
There are a couple of issues.
- Different platforms have different Tree Structures because they have different output structures. Therefore the mapping to the different objects within the output is different.
- You specify dt as the pointer to the "Data table", but later in the script, you attempt to execute the Overlay Plot, pointing to a data table referenced by a variable dt2, that does not exist in your code.
- In you code that creates the Associative Array, you use a variable from your Reference Data Table, called Reference. In the sample data you provided in the Optimize Loop Discussion, the variable in that data table is called Mean.
Below is a modification of your code that produces the following output
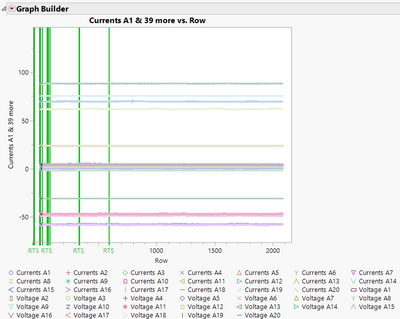
Names Default To Here(1);

// dt = Open("Data table.jmp"); // Open data table
dt=data table("Data Table");
// dt1 = Open("Reference table.jmp");
dt1=data table("Reference data table");
// Loop to get column name Currents and Voltages
colist = {};
Col_List = dt << Get Column Names("String");

For(q = 1, q <= N Items(Col_List), q++,
	If(Contains(Col_List[q], "Current") | Contains(Col_List[q], "Voltage"),
		Column(Col_List[q]) << Set Selected(1);
		Insert Into(colist, Col_List[q]);
	)
);
	// Overlay Plot

		vc = dt << Overlay Plot( Y( Eval( colist ) ), No Overlay( 1 ),Ungroup Plots( 1 ) );

aa_refs = Associative Array(dt1:Tests << get values, dt1:mean << get values);
// Loop to add reference line to the variability chart
For(i = 14, i <= N Items(colist), i++,
	If(Contains(aa_refs, colist[i]),
		Report(vc)[AxisBox(1)] << Add Ref Line(aa_refs[colist[i]], "Solid", "Green", "RTS", 2);
	);
);
Please take the time to read up on Display Trees in the Scripting Guide, available in the JMP Documentation Library, under the Help pull down menu.
- Mark as New
- Bookmark
- Subscribe
- Mute
- Subscribe to RSS Feed
- Get Direct Link
- Report Inappropriate Content
Re: Add reference line from the reference table
You could loop over colist and check if dt1 has that specific value with if statement and if it does then add reference line based on value found from dt1. Here is one option using Associative Array (you might have to add scaling to Y-axis for the variability charts, as reference lines can be hidden depending on their value).
Names Default To Here(1);

// dt = Open("Data table.jmp"); // Open data table
// dt1 = Open("Reference table.jmp");

// Loop to get column name Currents and Voltages
colist = {};
Col_List = dt << Get Column Names("String");

For(q = 1, q <= N Items(Col_List), q++,
	If(Contains(Col_List[q], "Current") | Contains(Col_List[q], "Voltage"),
		Column(Col_List[q]) << Set Selected(1);
		Insert Into(colist, Col_List[q]);
	)
);
	// Var Chart
vc = dt << Variability Chart(
	Y((Eval(colist))),
	X(:Wafer ID),
	Analysis Type("Choose best analysis (EMS REML Bayesian)"),
	Show Range Bars(0),
	Std Dev Chart(0),
	Points Jittered(1)
);// Reference data table

aa_refs = Associative Array(dt1:Tests << get values, dt1:Reference << get values);
// Loop to add reference line to the variability chart
For(i = 1, i <= N Items(colist), i++,
	If(Contains(aa_refs, colist[i]),
		Report(vc[i])[Framebox(1)] << DispatchSeg(CustomStreamSeg(3), {Line Width(2)});
		Report(vc[i])[AxisBox(1)] << {Add Ref Line(aa_refs[colist[i]], "Solid", "Green", "RTS", 2)};
	);
);
- Mark as New
- Bookmark
- Subscribe
- Mute
- Subscribe to RSS Feed
- Get Direct Link
- Report Inappropriate Content
Re: Add reference line from the reference table
Here is a slightly different solution, reading the reference table directly
Names Default To Here( 1 );
Clear Globals();


//dt = Open( "Data table.jmp" ); // Open data table
dt = Data Table( "data table" );

// Loop to get column name Currents and Voltages
colist = {};
Col_List = dt << Get Column Names( "String" );

For( q = 1, q <= N Items( Col_List ), q++,

	If( Contains( Col_List[q], "Current" ) | Contains( Col_List[q], "Voltage" ),
		Column( Col_List[q] ) << Set Selected( 1 );
		Insert Into( colist, Col_List[q] );
	)
);
	// Var Chart
vc = dt << Variability Chart(
	Y( (Eval( colist )) ),
	X( :Wafer ID ),
	Analysis Type( "Choose best analysis (EMS REML Bayesian)" ),
	Show Range Bars( 0 ),
	Std Dev Chart( 0 ),
	Points Jittered( 1 )

);// Reference data table
//dt1 = Open( "Reference table.jmp" );
dt1 = Data Table( "reference table" );
xb = Column( dt1, "Reference" ) << getValues;
// Loop to add reference line to the variability chart
For( i = 1, i <= N Items( vc ), i++,
	//Report( vc[i] )[Framebox( 1 )] << DispatchSeg( CustomStreamSeg( 3 ), {Line Width( 2 )} );
	testVal = Word( -2, Report( vc[i] )[Outline Box( 2 )] << get title, " " ) || " " || Word(
		-1,
		Report( vc[i] )[Outline Box( 2 )] << get title,
		" "
	);
	testRow = dt1 << get rows where( :tests == testVal );
	If( N Rows( testRow ) > 0,
		Report( vc[i] )[AxisBox( 1 )] << Add Ref Line( dt1:Reference[testRow[1]], "Solid", "Green", "RTS", 2 )
	);
);- Mark as New
- Bookmark
- Subscribe
- Mute
- Subscribe to RSS Feed
- Get Direct Link
- Report Inappropriate Content
Re: Add reference line from the reference table
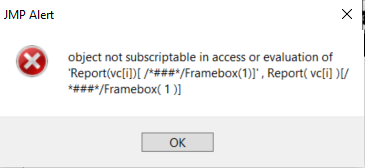
Hi @jthi ,
I tired your code on overlay plots but there's seems to an error. Any suggestions?
Names Default To Here(1);

// dt = Open("Data table.jmp"); // Open data table
// dt1 = Open("Reference table.jmp");

// Loop to get column name Currents and Voltages
colist = {};
Col_List = dt << Get Column Names("String");

For(q = 1, q <= N Items(Col_List), q++,
	If(Contains(Col_List[q], "Current") | Contains(Col_List[q], "Voltage"),
		Column(Col_List[q]) << Set Selected(1);
		Insert Into(colist, Col_List[q]);
	)
);
	// Overlay Plot

		vc = dt2 << Overlay Plot( Y( Eval( colist ) ), No Overlay( 1 ),Ungroup Plots( 1 ) );

aa_refs = Associative Array(dt1:Tests << get values, dt1:Reference << get values);
// Loop to add reference line to the variability chart
For(i = 1, i <= N Items(colist), i++,
	If(Contains(aa_refs, colist[i]),
		Report(vc[i])[Framebox(1)] << DispatchSeg(CustomStreamSeg(3), {Line Width(2)});
		Report(vc[i])[AxisBox(1)] << {Add Ref Line(aa_refs[colist[i]], "Solid", "Green", "RTS", 2)};
	);
);
- Mark as New
- Bookmark
- Subscribe
- Mute
- Subscribe to RSS Feed
- Get Direct Link
- Report Inappropriate Content
Re: Add reference line from the reference table
There are a couple of issues.
- Different platforms have different Tree Structures because they have different output structures. Therefore the mapping to the different objects within the output is different.
- You specify dt as the pointer to the "Data table", but later in the script, you attempt to execute the Overlay Plot, pointing to a data table referenced by a variable dt2, that does not exist in your code.
- In you code that creates the Associative Array, you use a variable from your Reference Data Table, called Reference. In the sample data you provided in the Optimize Loop Discussion, the variable in that data table is called Mean.
Below is a modification of your code that produces the following output
Names Default To Here(1);

// dt = Open("Data table.jmp"); // Open data table
dt=data table("Data Table");
// dt1 = Open("Reference table.jmp");
dt1=data table("Reference data table");
// Loop to get column name Currents and Voltages
colist = {};
Col_List = dt << Get Column Names("String");

For(q = 1, q <= N Items(Col_List), q++,
	If(Contains(Col_List[q], "Current") | Contains(Col_List[q], "Voltage"),
		Column(Col_List[q]) << Set Selected(1);
		Insert Into(colist, Col_List[q]);
	)
);
	// Overlay Plot

		vc = dt << Overlay Plot( Y( Eval( colist ) ), No Overlay( 1 ),Ungroup Plots( 1 ) );

aa_refs = Associative Array(dt1:Tests << get values, dt1:mean << get values);
// Loop to add reference line to the variability chart
For(i = 14, i <= N Items(colist), i++,
	If(Contains(aa_refs, colist[i]),
		Report(vc)[AxisBox(1)] << Add Ref Line(aa_refs[colist[i]], "Solid", "Green", "RTS", 2);
	);
);
Please take the time to read up on Display Trees in the Scripting Guide, available in the JMP Documentation Library, under the Help pull down menu.
Recommended Articles
- © 2026 JMP Statistical Discovery LLC. All Rights Reserved.
- Terms of Use
- Privacy Statement
- Contact Us