Don’t miss your chance to experience Discovery Summit Europe at our best available rate! Early bird registration through 31 Oct.
Graph Builder Toolbar streamlines interactive graphing. Creates shortcuts on Report and GraphBuilder Helpers toolbars. Download and install the extension.
Add H lines to the Graph Builder from the Column values
Created:
Aug 23, 2023 10:23 AM
| Last Modified: Aug 23, 2023 7:25 AM(1663 views)
Hello,
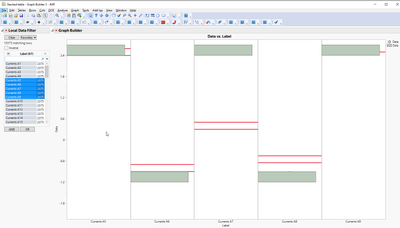
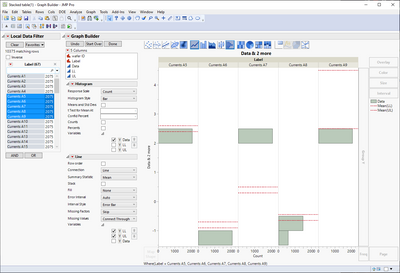
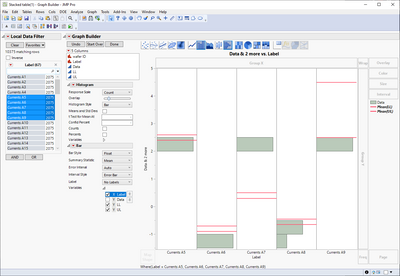
I am trying to add LL and UL lines to each label group of the GB plots. Based on the local data filter selection, I want to create a function that will add H lines from the UL and LL columns to the graph builder corresponding to the respective labels. Is this something that could be done?