- Mark as New
- Bookmark
- Subscribe
- Mute
- Subscribe to RSS Feed
- Get Direct Link
- Report Inappropriate Content
ANOVA assumption test
Hi JMP community!
I run into a question when doing my data anlysis project. I want to test that whether differnt types of products are statistically different in prices. I use ANOVA to do the testing. Before that, I created a boxplot of prices for differnt types of products. I'm wondering whether I should exclude outliers indicated by the boxplot before doing ANOVA analysis.
It would be really helpful if you can provide me some insights. Thank you so much!
Accepted Solutions

- Mark as New
- Bookmark
- Subscribe
- Mute
- Subscribe to RSS Feed
- Get Direct Link
- Report Inappropriate Content
Re: ANOVA assumption test
In my opinion, outliers should not be eliminated, unless there is a causal effect unrelated to the analysis, which made the values what they ended up having. If non can be found, then you should make the assumption the values are part of your valid distribution. But that leads us to the next issue, ANOVA assumes the data are normally distributed. With skewed data(outliers may have caused such), the data may not be normal in form. When this happens, you should look to normalize the data through transformation. The Distribution Platform in JMP can help you with the determination of whether or not the data are normal and if not, it may be able to provide you with a transformation you can use to convert to normal for the analysis.

- Mark as New
- Bookmark
- Subscribe
- Mute
- Subscribe to RSS Feed
- Get Direct Link
- Report Inappropriate Content
Re: ANOVA assumption test
Thank you so much Jim! This helps a lot!

- Mark as New
- Bookmark
- Subscribe
- Mute
- Subscribe to RSS Feed
- Get Direct Link
- Report Inappropriate Content
Re: ANOVA assumption test
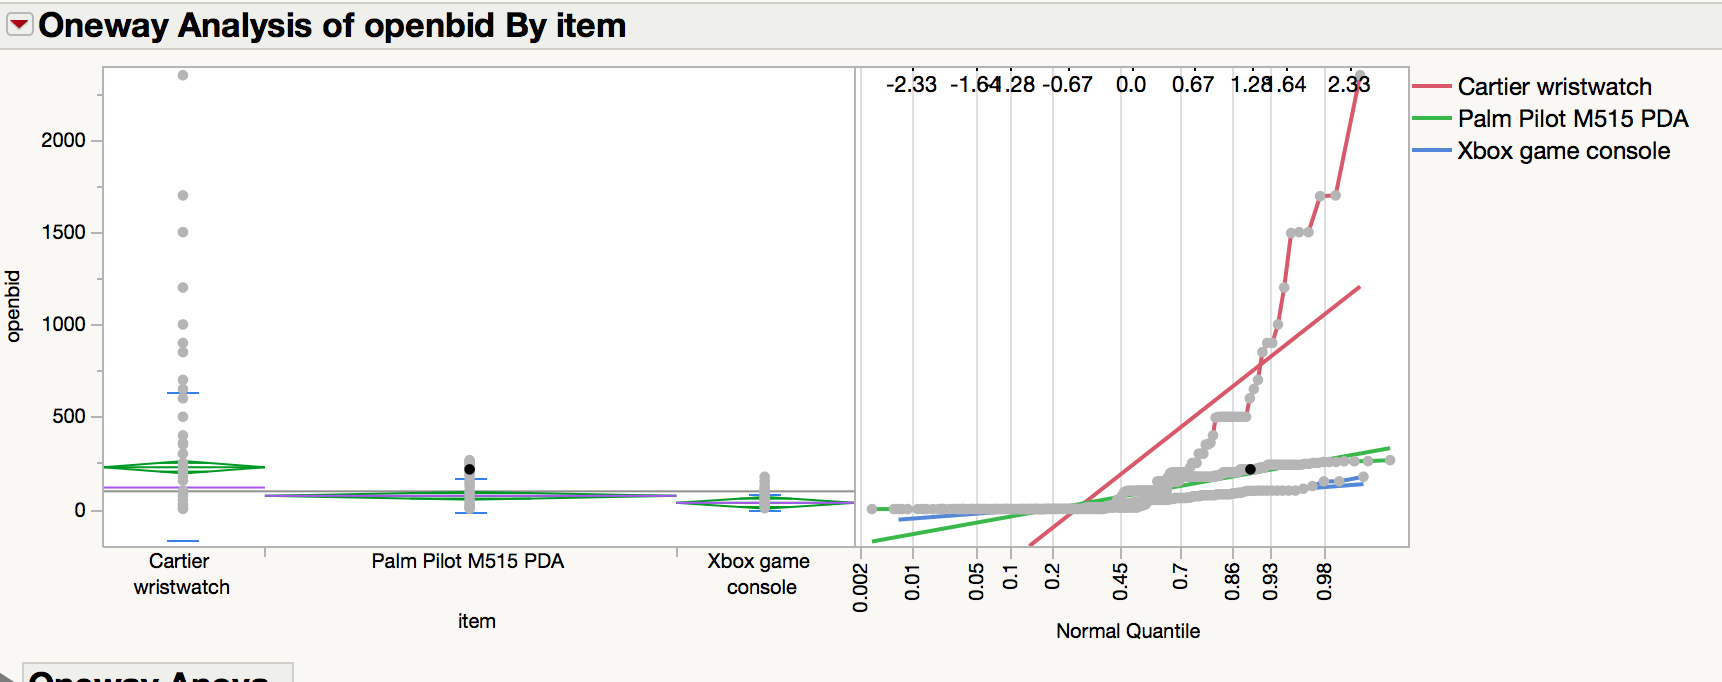
I really like the Normal Quantile Plot option in Oneway. This plot overlays the normal distribution of each group in the same plot. The y-intercept is the mean and the slope is the standard deviation. You can check ANOVA assumptions (only population difference is the mean (vertical displacement of lines), populations have same variance (lines are parallel), and check for outliers) all at the same time.
- Mark as New
- Bookmark
- Subscribe
- Mute
- Subscribe to RSS Feed
- Get Direct Link
- Report Inappropriate Content
Re: ANOVA assumption test
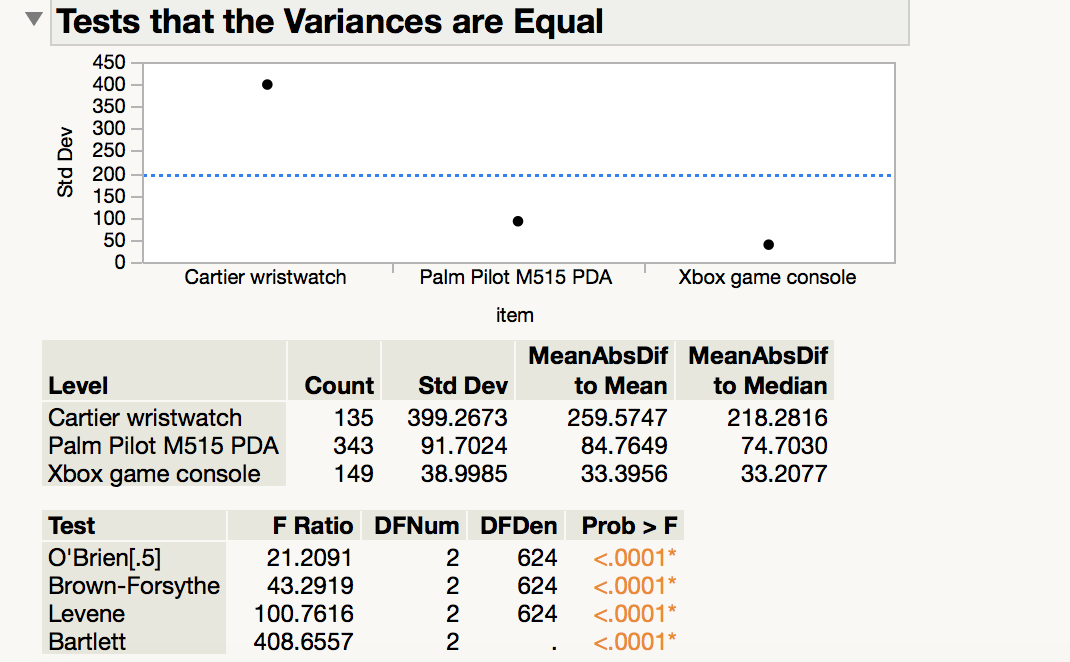
In addition to Jim's insight, you also want to check the assumption that the variance is constant across the groups because the test models variance this way and pools the estimates across the groups. So be sure to also click the red triangle next to Oneway and select Unequal Variances for this check of another important assumption.
- Mark as New
- Bookmark
- Subscribe
- Mute
- Subscribe to RSS Feed
- Get Direct Link
- Report Inappropriate Content
Re: ANOVA assumption test
Thank you so much for your reply!
I understand that I need to check whether dependent vairable is normally distributed and variance is equal. I tried the normal quantile and unequal variances in JMP. I also attached the result in this post. However, it seems that my data are not normally distributed and have unequal variances. I wonder how to deal with unequal variances.
- Mark as New
- Bookmark
- Subscribe
- Mute
- Subscribe to RSS Feed
- Get Direct Link
- Report Inappropriate Content
Re: ANOVA assumption test
You might try transforming the response. Heavily skewed data often benefits from the natural logarithm function. Alternatively, analyze the data with Fit Least Squares to determine the best power transformation:
- Select Analyze > Fit Model
- Select Openbid and click Y
- Select Item and click Add
- Click Run
- Click the red triangle next to Response and select Factor Profiling > Box Cox Y Transformation
Examine the plot of SSE versus lambda. If no transformation is helpful, the minimum SSE should be found near lambda = 1. Lambda = 0 is essentially the same as a log transformation. Click the red triangle next to Box Cox and select Save Best. Now repeat your analysis using Openbid X as the response.
See if this change helps meet the assumptions.
