cancel
Showing results for 
Show  only  | Search instead for 
Did you mean: 
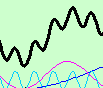
  • Image to Table JMP extension imports single or batch images as data tables. Useful to extract curves from pictures or convert image data to curve data to use in analyses like Functional Data Explorer. Download and install the extension.
JMP Bar Chart

Welcome to the JMP User Community!

Ask questions, get answers, meet other JMP users

Learning Resources

Latest Discussions

  • Local Data Filter on Control Chart Builder - Excluded Rows

    I have a stacked table that I am making control charts from. I have a report window, and I am appending a Control Chart Builder to a VListBox in this window. To the control chart builder, I have added a local data filter on the column that indicates which parameter my data belongs to. So to simplify, you can imagine my data table has 4 columns: Batch - Used to group the data on the x-axis of my co...

    jevanove jevanove
    Discussions |
    Apr 7, 2026 12:48 PM
    1168 views | 3 replies
  • Exclude data points from a regression line, but make them still visible in the diagram

    Hey everybody! I used a training set of data points to create a linear regression (signal intensity as a function of substance concentration within samples), and applied the resulting formula on a test set of data points for a reverse prediction of the associated sample's substance content. Now I would like to showcase the data points of the training set, the regression line that visualizes the li...

    Lukas_Häfner Lukas_Häfner
    Discussions |
    Apr 7, 2026 11:46 AM
    8393 views | 8 replies
  • Can't JMP 19 use the mouse wheel to control the vertical scroll bar of the table to move up and down?

    JMP 18 is normal, but I didn't succeed using JMP 19.1.0.
    64-bit Windows 11 Simplified Chinese version system.
    Thanks Experts! dt=Open("$SAMPLE_DATA/Big Class.jmp");

    lwx228 lwx228
    Discussions |
    Apr 6, 2026 7:26 AM
    1431 views | 6 replies
  • Finding Effect Magnitudes for Non Orthogonal DOE

    Hi, I’m pretty new to JMP and had a question about interpreting regression vs orthogonalized effects. I ran a 3-factor, 3-level DOE (X, Y, Z) using simulations to look at main effects and interactions on a response (force). I was missing a few runs, so the design isn’t fully orthogonal. I used Fit Model to run a regression and got the usual outputs (Estimate, t Ratio, Prob>|t|). I also looked at t...

    RandomSquirrel1 RandomSquirrel1
    Discussions |
    Apr 4, 2026 11:21 AM
    2346 views | 7 replies
  • why ::labelslist ?

    Names Default to Here(1); dt = Open( "$SAMPLE_DATA/Big Class Families.jmp" ); labelsList = {"F" = "A", "M" = "B"}; //here namespace ::labelsList = {"F" = "①", "M" = "②"}; // global variable f = function ({}, {default local}, labelsList = {"F" = "X", "M" = "Y"} ; // local variable dt:sex << Set Property( "Value Labels", labelsList ) // which variable will JMP pick? ); f JMP 19.1:  ①,②
    JMP 18.2...

    hogi hogi
    Discussions |
    Apr 3, 2026 10:17 PM
    999 views | 3 replies

Latest Discussions

  • Local Data Filter on Control Chart Builder - Excluded Rows

    I have a stacked table that I am making control charts from. I have a report window, and I am appending a Control Chart Builder to a VListBox in this window. To the control chart builder, I have added a local data filter on the column that indicates which parameter my data belongs to. So to simplify, you can imagine my data table has 4 columns: Batch - Used to group the data on the x-axis of my co...

    jevanove jevanove
    Discussions |
    Apr 7, 2026 12:48 PM
    1168 views | 3 replies
  • Exclude data points from a regression line, but make them still visible in the diagram

    Hey everybody! I used a training set of data points to create a linear regression (signal intensity as a function of substance concentration within samples), and applied the resulting formula on a test set of data points for a reverse prediction of the associated sample's substance content. Now I would like to showcase the data points of the training set, the regression line that visualizes the li...

    Lukas_Häfner Lukas_Häfner
    Discussions |
    Apr 7, 2026 11:46 AM
    8393 views | 8 replies
  • Can't JMP 19 use the mouse wheel to control the vertical scroll bar of the table to move up and down?

    JMP 18 is normal, but I didn't succeed using JMP 19.1.0.
    64-bit Windows 11 Simplified Chinese version system.
    Thanks Experts! dt=Open("$SAMPLE_DATA/Big Class.jmp");

    lwx228 lwx228
    Discussions |
    Apr 6, 2026 7:26 AM
    1431 views | 6 replies
  • Finding Effect Magnitudes for Non Orthogonal DOE

    Hi, I’m pretty new to JMP and had a question about interpreting regression vs orthogonalized effects. I ran a 3-factor, 3-level DOE (X, Y, Z) using simulations to look at main effects and interactions on a response (force). I was missing a few runs, so the design isn’t fully orthogonal. I used Fit Model to run a regression and got the usual outputs (Estimate, t Ratio, Prob>|t|). I also looked at t...

    RandomSquirrel1 RandomSquirrel1
    Discussions |
    Apr 4, 2026 11:21 AM
    2346 views | 7 replies
  • Removal of Empty() from cell

    I import lots of photos into JMP as part of my work. When complete, blank cells in columns containing photos show "EMPTY()". Prior to JMP 19, I could delete this and it would show a dot in the cell. With JMP 19 I am unable to delete the expression. Is there a way to remove it? If not, why the change?

    RP_64 RP_64
    Discussions |
    Apr 2, 2026 8:17 AM
    606 views | 1 replies

Latest Discussions

view all discussions