Reed–Muench method is the simplest and most intuitive way to determine an endpoint in a biological procedure.
The above methodology was published in The American Journal of Hygiene in 1937. A Simple Method of Estimating Fifty Per Cent Endpoints This is the methodology described in the paper.
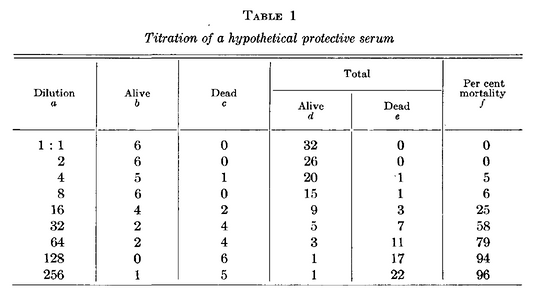
Make the data presented in the thesis into a JMP Data Table. In the data corresponding to Table 1 of the paper, the data corresponding to dilution is quantified through log transformation.
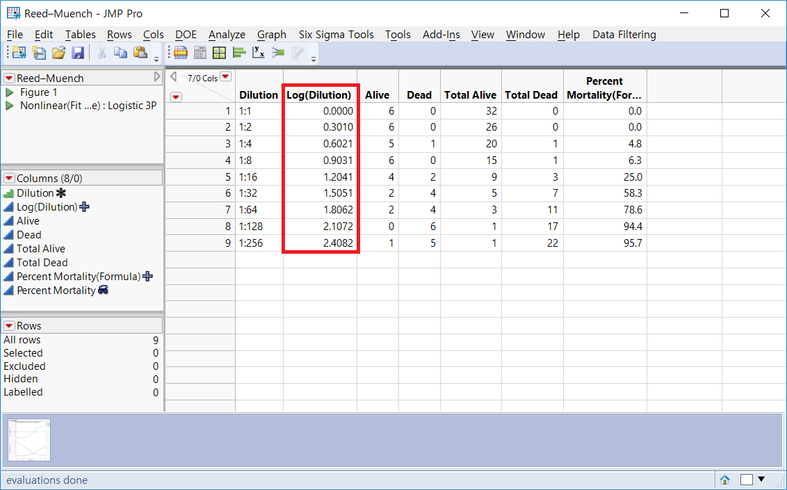
To create a variable called Log(Dilution) in the red box above, you need to create a simple formula (JSL Code) as shown below.
Log10(
 Num( Substr( :Dilution, 3, 3 ) ) /
 Num( Substr( :Dilution, 1, 1 ) )
)
After getting the 3-digit value from the 3rd digit in the dilution variable, take the Log10 value.
After performing the above operations, use Log (Dilution) on the X axis and Percent Mortality on the Y axis to fit the curve using JMP Graph Builder. Below that, a graph of overall survival/death is also shown.

The endpoint we want to find here is Dilution, where the Percent Mortality value is 50%. In the actual paper, interpolation was used to calculate manually, but here, we will use JMP's Nonlinear Modeling method to find the value.
To use this method, select Analyze >> Specialized Modeling >> Nonlinear menu.
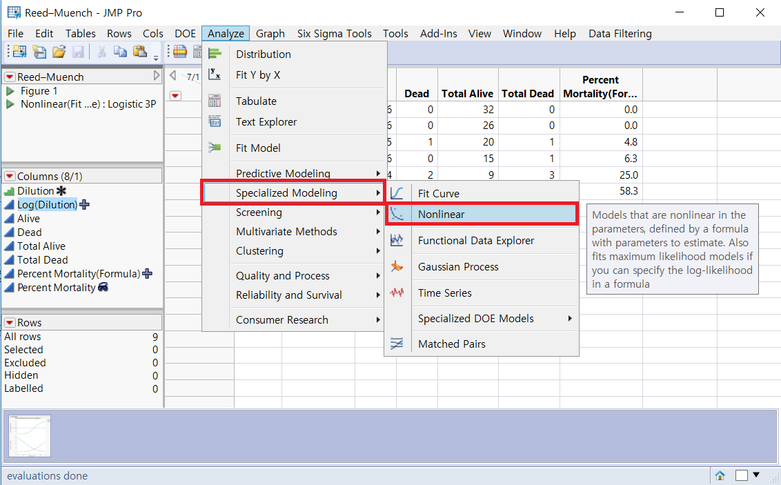
It goes through the following steps:
One. Nonlinear Fitting (Logistic or Probit or Weibull, etc.)
2. Estimating the Log(Dilution) value at which the percent mortality is 50% through inverse estimation
3. Transform to return the log transformation value.
in the order above
One. Nonlinear Fitting
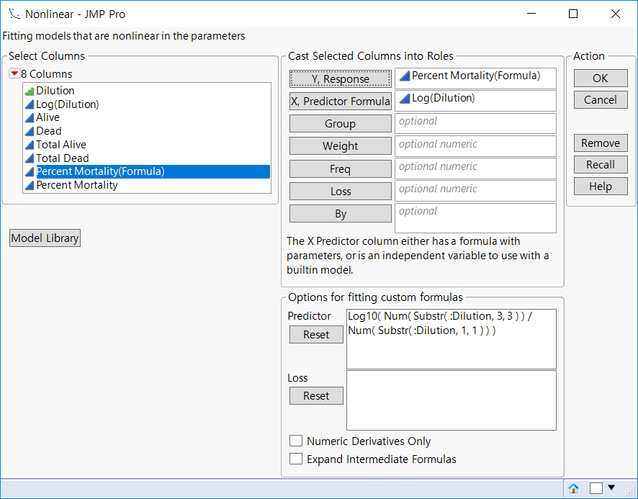
Specify Percent Mortality for Y response and Log(Dilution) for X Predictor Formula.
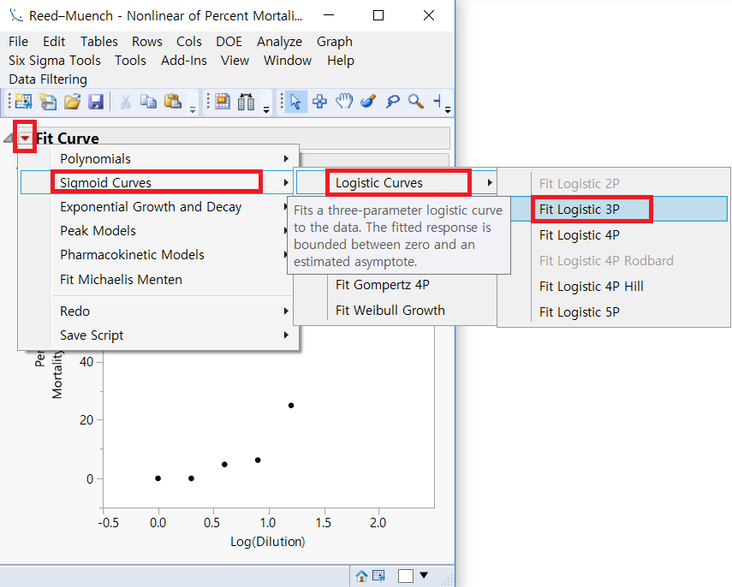
Press the Hot Spot (Red Triangle) on the left side of the Fit Curve and select Sigmoid Curve >> Logistic Curves >> Fit Logistic 3P. Alternatively, fitting is possible with Probit or Weibull.
2.Log (Dilution) value estimation that satisfies 50% percent mortality through inverse estimation
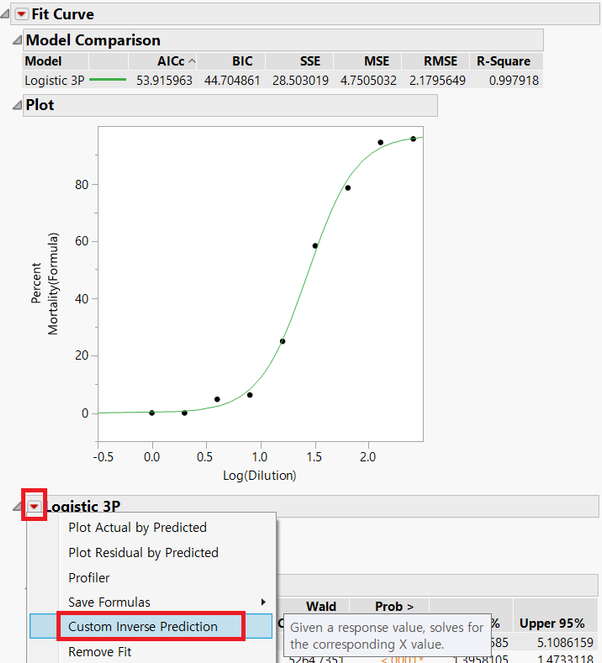
Click the Hot Spot on the left side of Logistic 3P and select Custom Inverse Prediction
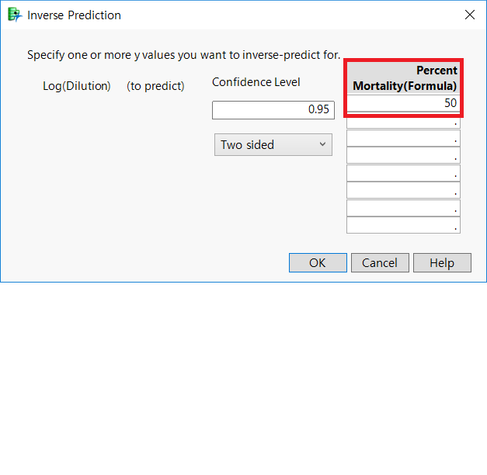
Enter the desired value (50%) in the red box above.
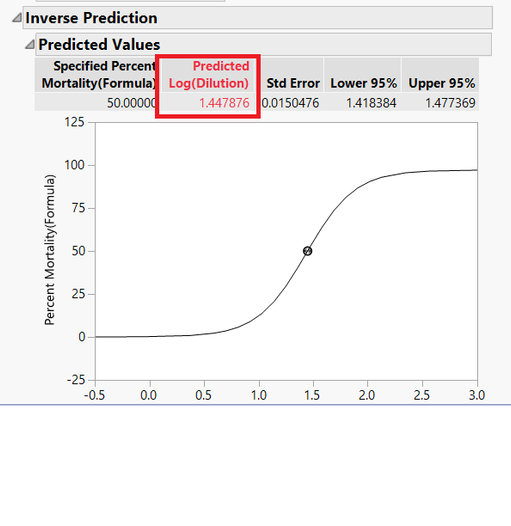
This gives you the desired value of 1.447876.
Using this to get 10^(1.447876) for the next step 3, the conversion, we get 28.05.
in other words, 1:28 This becomes the Dilution endpoint where the Percent Mortality becomes 50%.