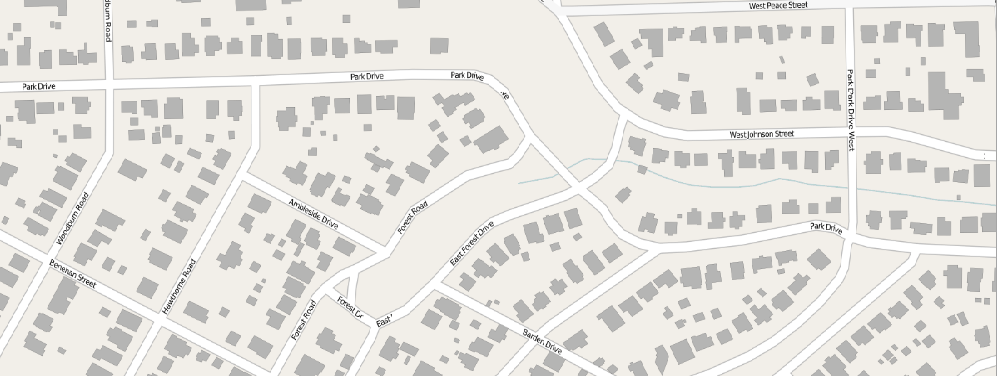
Here's a 2D neighborhood. (Thanks to JMP's OpenStreetMap connection!) You can imagine a 1D neighborhood too, but 1D isn't very interesting.

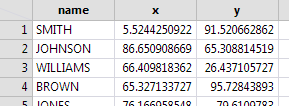
And you can imagine a 3D neighborhood in a city with high-rise buildings; each of your neighbors gets a latitude, longitude, and altitude coordinate. An interesting question in any nD (n > 0) space is "who's my nearest neighbor?" Nearest neighbors can be identified on a 2D map without too much trouble. But what if all the Latitudes, Longitudes, Altitudes are in a data table? With  one row per neighbor? Here's a 2D table with 1000 rows. One way to find SMITH's nearest neighbor would be to compute his distance to every other neighbor, sort the distances, and pick the smallest. Not too bad, if you only need to do it once. But not nearly as satisfying as looking at the 2D map for SMITH's house and just seeing his nearest neighbor. (Interesting fact: if Fred is Joe's nearest neighbor, Joe might not be Fred's nearest neighbor. Nearest neighbor chains form the heart of the clustering platform's "fast Ward method".)
There is a better way to find nearest neighbors, if the question needs to be answered for a lot of people in the table. The 1D problem "isn't very interesting" because the houses are already ordered in a line, and by sorting the data, just once, the nearest neighbor to anybody in the line can be found by looking at the distance to only two other neighbors...the two next-door neighbors. Is there some way to sort the 2D rows in the data table, once, so the across-the-street neighbor and the out-the-back-door neighbor can be found just as easily as the two next-door neighbors? Sort simultaneously by X and Y? Yes...
JMP's KDTable function creates a JSL object from K-Dimensional data for efficiently looking up nearest neighbors. It makes the nD problem look like the 1D problem, which is pretty satisfying. A KDTable is constructed from a matrix with K columns (K is the number of dimensions...2 for the example table of neighbors, 3 for high-rise dwellers.) Each row in the matrix is a point in the K-dimensional space (1000 neighbors in the example.) To make the KDTable from the data table, just grab the x and y columns as matrices and use the || matrix concatenation to turn the two 1000x1 column vectors into a 1000x2 matrix:
dt = Open( "$desktop/RandomNameLocation.jmp" );
mat = (dt:x << getvalues) || (dt:y << getvalues);
Show( N Rows( mat ), N Cols( mat ) );
kdt = KDTable( mat );
N Rows(mat) = 1000;
N Cols(mat) = 2;
Kdt is the JSL variable that holds the KDTable object. The object has several methods; <<KNearestRows is the most interesting:
kdt<<K nearest rows(2,1)
{[984 169], [0.684553526256623 2.00033962590788]}
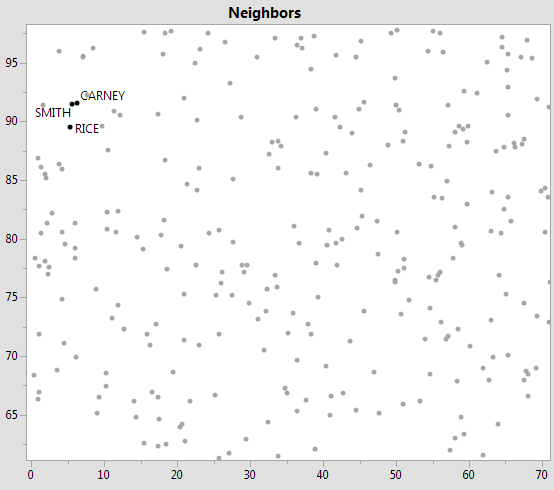
The first argument, 2, is requesting the 2 nearest rows, and the second argument, 1, is the row (SMITH's row) to compare them to. The returned value is a list of two matrices. The first matrix identifies the two rows (984 is CARNEY and 169 is RICE.) Here they are:

Clearly, CARNEY is much closer than RICE. This is the simplest way to use the K Nearest Rows method--with an actual row number in the table. It is also possible to use an arbitrary K-dimensional coordinate as a matrix of 1 row and K columns. It is also possible to leave off the last argument, in which case the returned list will contain matrices with nearest neighbor/distance for every row (1000 for the example.)
The KDTable returns the nearest neighbor very quickly. The next nearest neighbor takes a bit longer to discover, and so on. Setting the first argument to 999 will, in fact, return a sorted list of all the nearest neighbors, and runs fast enough for 1000 total rows, but remember--the table excels at finding the nearest neighbors, not far-away neighbors.
Because the slow-down begins with distance, the first argument (which limits the returned number of neighbors) can be specified with a radius limit in addition to the number of neighbors. For example,
kdt<<K nearest rows({20,5},1)
{[984 169 745 403 506 772 977 864 12 0], [0.684553526256623 2.00033962590788
2.27070259974598 3.94275990709721 4.20575097464916 4.29873200846626 4.6027795012889
4.82632837039104 5.48011662134314 0]}
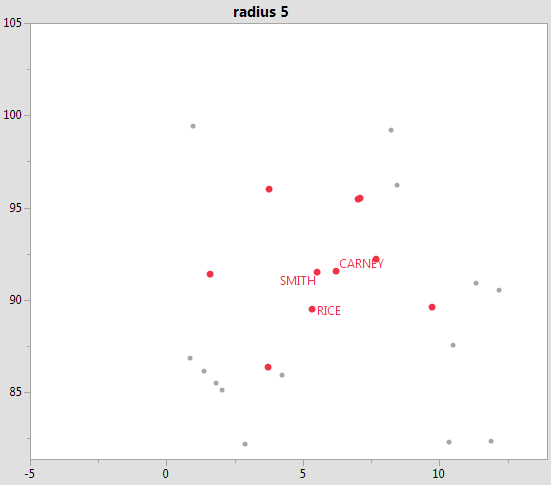
asks for up to 20 rows, up to a radius of 5. Row 12 is at a radius of 5.4 and stops the search after only 9 neighbors
 have been found. The zero sentinel at the end is not a valid row number and means the radius-limit stopped the search. In a cloud of 1,000,000 points with a non-uniform distribution, asking for the 20 nearest neighbors can be fast in densely populated areas and slow on the outskirts. Putting a reasonable radius limit can make the difference between a sluggish response and a snappy response.
The KDTable object should be constructed once, then used over and over. The KDTable's internal data structure builds as fast as it can, but it is much, much faster to ask it questions about neighbors after it is built.
There are two scripts, clouds and spiders, to further explain how to use the KDTable function. Both are interactive (drag the small white square). The point cloud example can be edited for more points in the cloud (two million is not too many) and the spider example has a check box for making it creepy. And the video in last week's post used KDTable, a lot.
Update 8Oct2018: repair formatting