The Arduino
The Arduino is a small computer. And inexpensive. And a child near you should have one for whatever holiday comes up next, but you should get it out of the box and play with it first. There's plenty of online support for the hardware and the development system.
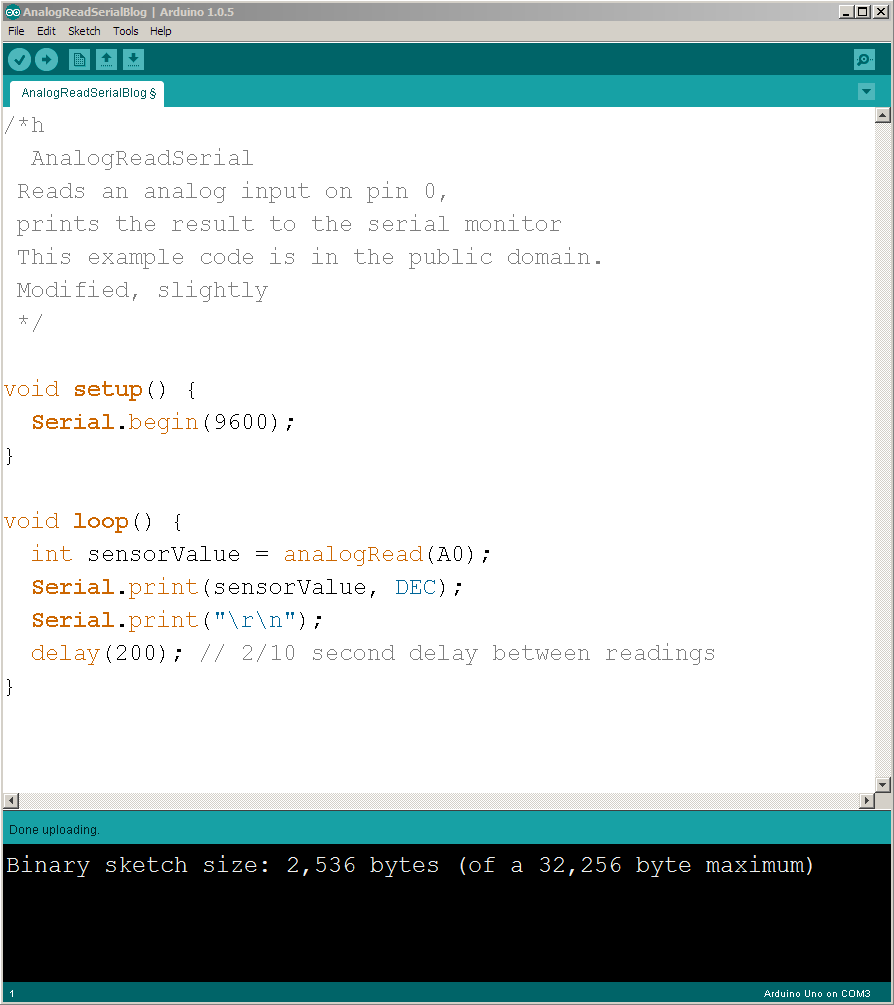
This project will connect an Arduino to JMP and do some real time data logging. You'll need the Arduino IDE download; here's a picture of the IDE holding the program. 
![]()
This tiny program does two things: initialize the serial communications when the power is turned on, and then spend the rest of its life reading an analog signal and printing the value to the serial port.
The circuit
The sensor for this project is a CdS photo-resistor. Here's a picture of the breadboard circuit.

the photo-resistor (round with squiggly line, center rear) and the 43K ohm resistor (yellow-orange-orange-gold) next to it form a voltage divider across the black wire (ground) and red wire (5 volt) power supply. The white wire on the center tap of the divider goes to A0 on the blue Arduino UNO board. A0 is the analog input the program above is reading. When the photo-resistor is dark, its resistance is very high (compared to the 43K ohm resistor, and the white wire's voltage will be near ground (0 volts). When brightly lit, the photo-resistor's resistance is very low and the white wire will be close to 5 volts.
You used the USB cable as a serial port to load the program into the Arduino. It might be com3 or com4 or maybe another choice. JMP will be listening on that same USB serial connection. That's a cool blue USB cable that might come with the Arduino, depending on the vendor.

The JSL
Make a data table with two columns; the time column will be filled in with the number of seconds since the capture began. The sense column will be filled in with the data from the Arduino.
dt = New Table( "capture",
  Add Rows( 0 ),
  New Column( "time", Numeric, Continuous, Format( ":day:hr:m:s", 21, 3 ) ),
  New Column( "sense", Numeric( 2 ) ) // the analog sensor is 0..1023
);
remember the start time
start = Tick Seconds();
Open JMP's Datafeed, set up the parameters, and supply a script to process each line of data from the Arduino. COM3 is probably not what your Arduino is connected to.
feed = Open Datafeed(
  Connect( Port( "com3" ), Baud rate( 9600 ), Parity( even ), DataBits( 7 ) ),
  Set Script(
  x = feed << getLine;
  dt << addrows( 1 );
  dt:time = Tick Seconds() - start;
  dt:sense = Num( x );
  )
);
Run a control chart (or a graph builder script) to see the data collection in action.
dt << Control Chart( Sample Size( 1 ), KSigma( 3 ), Chart Col( :sense, Run Chart() ) );
Action
In this 5 minute clip you'll see the control chart updating as the data arrives; the data values change depending on the light that reaches the sensor. You'll also see the axis scrolled to display more of the data and notice a lag in the response time while JMP catches up with the data. There is no handshaking; it is quite possible for data to be lost. The 200ms pause in the Arduino code (way above) is designed to give JMP time to process the data and update the display.
Arduino - YouTube
![]()