Godzilla is one of the most successful movie monsters of all times! First bursting on the scene 1954, he has appeared in many movie sequels over the years. But did you know that the relative size of Godzilla has grown with each passing year, with his largest size being represented in his latest 2019 movie release? Why would Godzilla need to grow, especially since he was always more than big enough to wreak havoc on any human city that stood in his way? Can JMP Graph Builder help us see if this claim is true and if we should be worried about the next time Godzilla comes to our town?

Source: Custom Art by Samantha de Gorostiza Wise (SWG)
The alarming growth rate of Godzilla over the years was highlighted in the entertaining article titled “How New York Would Officially Respond to a Godzilla Attack?” (https://www.theawl.com/2014/05/how-new-york-city-would-officially-respond-to-a-godzilla-attack/). In this article, a city official was asked if he worried about being surprised by a Godzilla surprise attack that would catch the city unprepared. The official said, no problem, we will have plenty of time to evacuate the city and call in the military! Why so sure? He pointed out that Godzilla is now so huge that he is bigger than the average depth of New York Harbor. Therefore, he felt sure that the whole city would have plenty of warning as they would see Godzilla coming from miles and miles off in the distance!
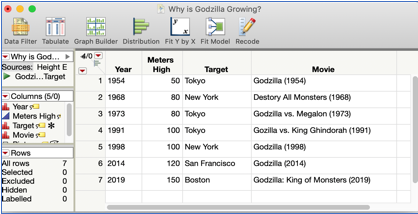
To get the Godzilla height data for our graph exploration, we used the above article as well as another good resource article titled “Godzilla Cities Attacked,” (https://www.inverse.com/article/30488-godzilla-every-city-kaiju-attack-tokyo-new-york-ghidora-king-k...). Here we can see in the table that we now have an estimated height in meters for the different incarnations of Godzilla. We picked just seven of the many Godzilla movies to show a good sample of his growth over the years, starting with his first appearance in 1954 till his latest screen debut in 2019.
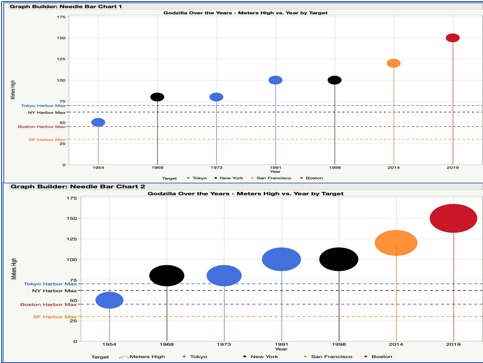
While there would be many ways to graph this data, we thought it would make for a more compelling visual to instead use a special type of bar chart called a Needle Bar Chart. The Y Axis shows the Godzilla’s Meters High size and the X Axis shows the Year of the movie appearance. We also colored the Points on top of these needles by the main city Godzilla attacked in that movie. Lastly, we also included Reference Lines noting the average meter depth of each of the city harbors to see how Godzilla’s size would compare.
The first graph is a good start but doesn’t really give you a good feel for the increasing size of Godzilla, other than the Needle height. On the second chart we sized the Points on the graph by Meters High. This provides a better view, but still leaves us looking for additional chart features that would make for a more compelling view!
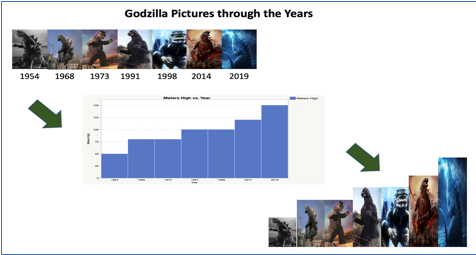
We decided that another graphing feature that might help would be to include a picture of Godzilla from each time period movie. It would also be nice to have the pictures dimensions scaled by the relative size of Godzilla for the represented year. We do this by first arranging the pictures outside of JMP in a slide. Then we copied into the slide a Bar Graph of Godzilla’s Meters High by Year with a wider bar style. This allows us to use this bar graph as a template to copy and paste the pictures onto the bars to provide an appropriate Scaled Picture Bar Graph.
Once this is completed, we can now copy these individual picture bars into the JMP Datatable using a new column data type feature called an Expression Rolethat brings in these pictures and respects their respective scaling. Then by taking our last Needle Bar graph and enabling Labels for our picture column, we can now surface the scaled pictures and other data point details when we hover over the points.
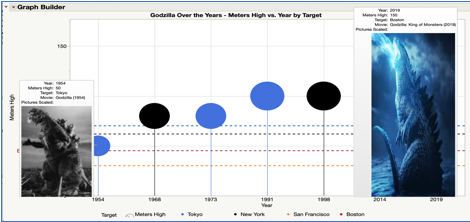
But why not see all the pictures at once and get the best of all graph types? To do this we will paste in the entire Scaled Picture Bar Graph to create a combined Picture and Needle Bar Chart! Now we can visually feel the impact of the growing Godzilla!
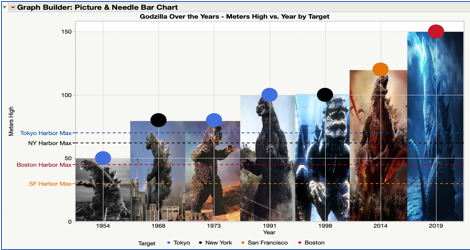
As for the reasons for Godzilla’s huge growth, we can only speculate. Some might say it is a byproduct of Godzilla’s nuclear-powered energy source. Other’s will point out that modern movie effects are to blame, as modern film makers are no longer limited to just filming actors in monster suites like in the early days. Regardless of the reason, this growing trend is real and the next time we see Godzilla there is no telling how much higher he may have grown. Then we may all be singing that words from 70’s rock band Blue Oyster Cult’s hit song.…”Oh no, they say he’s got to go…go, go Godzilla”
You must be a registered user to add a comment. If you've already registered, sign in. Otherwise, register and sign in.