Source: Artwork by Samantha Wise
If you live in the great state of Texas, I believe you will quickly find two things to be true. The first is that we have some of the best beef BBQ on the planet! The second is that nothing beats the feeling of wearing a really good fitting pair of cowboy boots! But these things are dependent on our vast supply of cattle. So of course, I was personally filled with alarm when I heard that UFO (Unidentified Flying Object) sightings are on the rise all across our country. In popular culture, these alien visitors often like to “beam up” and take off with our cows…and this would be a big threat to our favorite footwear and food! So, can we get some actual data to understand if this threat is real?
Data Source:
There are actually many sites that have collected public and declassified military/government reports of actual UFO sightings. A good source that can be found on the Kaggle website is a database from the National UFO Reporting Center (NUFORC) that contains records of reports over the last century (https://www.kaggle.com/NUFORC/ufo-sightings). This data has not only descriptions, but also contains the location and date of each sighting. So, let’s see if there is truly a trend of increasing UFO sightings and if so, where is it happening and what might be causing it?
Overall Sightings Trend:
We took a subset of this data for UFO sightings in Texas from 2000 to 2013 (latest fully reported year in the database) and tallied up total sightings by year to look at the trend utilizing a combined Line, Point and Bar chart in JMP Graph Builder.

Texas, as most other US States, seems to have seen a distinct increase in total UFO sightings over this time period. While increases in state population could be a factor, this alone would not seem to be enough to explain this large of an upward trend. So, the next step is to drill down on where in Texas these sightings are taking place to help understand what is driving this uptick in sightings.
Sightings Map:
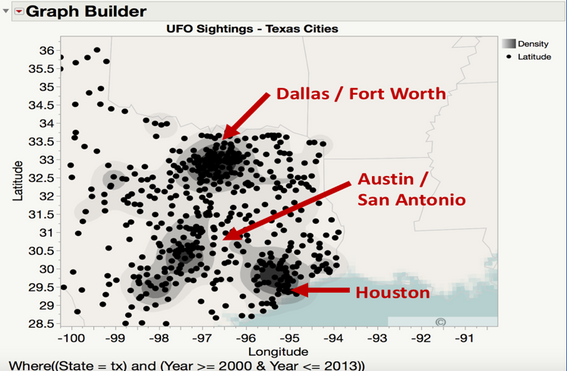
We can visualize the location where these sightings occurred geographically by plotting the latitudinal and longitudinal locations on a map. JMP Graph Builder allows us to even spruce up our map with density contours to make it easier to see where location points are grouped in larger numbers. It can be seen that more UFO sightings occur in the bigger Texan cities, like my location in Austin. This is most likely to be expected, as these are some of the biggest cities in the US and have more people and air traffic than smaller towns in the countryside, thereby increasing the chances for sightings. However, this view is still limited in explanatory value as we don’t get any insight into differences from sighting to sighting that could help explain the trend.

Sightings Map with Marker:
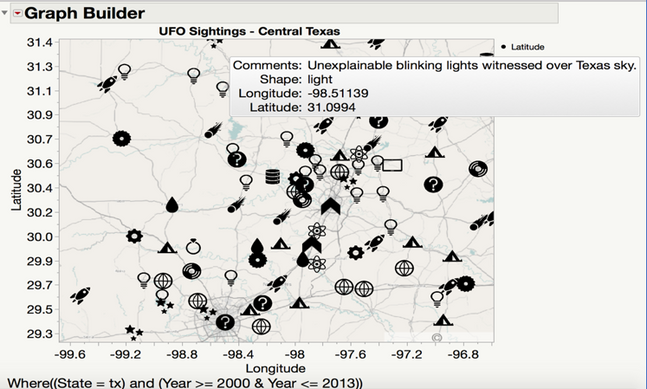
We went back to the data and found that each UFO sighting was also given a shape type that corresponded with its general appearance. Most of these shapes seemed grouped into physical appearance shapes (like triangles, circles, cigars, etc.) or descriptions of luminescence (lights, flashes, fireballs, etc.). We found icons to use that were close to these described shape categories as seen below.

Using these icons as markers on the map definitely provides a lot more information. Further hovering over the point also allows us to pull up the text details of the sighting, such as the one below explaining a light shaped UFO sighting.

Sightings Trend Chart with Shape Marker:
This led us to wonder if a particular shape of UFO sighting might be making up more of the observed increases over time. When we looked at some common shapes seen in and around Texas (lights, triangles, circles & cigar shapes), it is now clearer that light shaped sightings seem to have a steeper increase over time.

Summary:
The use of these JMP Markers really helped us bring more information into our maps and show that there may indeed be an increase in sightings over time. Some possible reasons that we came up with might be due to the increase in the use of recreational drones or increased commercial/military flight activity. Even access to better cell phone camera technology to capture strange things in the sky may be part of the cause of the increases. Whatever it is, we took some comfort that most of the increase comes from UFO sightings that are more light-based than physical-based shapes, thereby perhaps keeping safer our supply of beef BBQ and boots for years to come! So next time you look up into the sky you might now look just a little harder for UFOs in the sky, and if you do perhaps you will want to hum a chorus of The Byrds “Mr. Spacemen” which goes:
“Hey, Mr. Spaceman,
Won't you please take me along,
I won't do anything wrong.
Hey, Mr. Spaceman,
Won't you please take me along for a ride.”
Bonus:
Data and most graphs used in this blog are now available over JMP Public so you can explore it for yourself: Texas-UFO-Sightings