- Subscribe to RSS Feed
- Mark Topic as New
- Mark Topic as Read
- Float this Topic for Current User
- Bookmark
- Subscribe
- Mute
- Printer Friendly Page
Nordic JMP Users Group
- JMP User Community
- :
- JMP Users Groups
- :
- JMP Users Groups in EMEA
- :
- Nordic JMP Users Group
- :
- Forum
- :
- Presentation & script: Re-standardization of relative data with preferential use...
- Mark as New
- Bookmark
- Subscribe
- Mute
- Subscribe to RSS Feed
- Get Direct Link
- Report Inappropriate Content
Presentation & script: Re-standardization of relative data with preferential use for assessing stability data
Attached to this post, find the script and presentation shown by the Aker BioMarine representative during the 2023 Nordic JMP Users Group meeting.
A few words of warning:
- As highlighted during the Q&A, there are issues with the underlying assumptions and it follows that re-standardization of relative data is not necessarily statistically sound. Also, as one participant pointed out, it may be more useful to have uncertainty intervals also, or perhaps preferably, for the X axis (time) rather than the measured quality control parameter (Y axis).
- The script shared assumes that it is permitted to pool the (hypothetical stability) data for different batches under one product category. More correctly, it does not allow the user to look at individual batches, only products. This requires statistical testing of poolability, and; presumably; it is fairly easy to add one more panel to allow filtering of batches.
- The script requires that the data table used by it already has at least one relative column that has a value of exactly 100 at t=0.
- I am extremely confident that this script is not efficiently written and I am also confident I have poor understanding with regards to many of the solutions used. Some of the solutions were identified by trial & error without building an understanding of the underlying processes. The references in the script are probably also not extremely watertight, which you may test by having more than one table open at once before running the script.
- Following a combination of a button selections that do not have any data to show and reverting to a combination that has data to show will (kind of erratically) open the "Linear Fit" outline box with the regression statistics. I was not able to fix this.
- Naturally, the button allowing access to our database holding the data table with specification limits was removed (in case you remember that this feature was shown).
Overall, I am still relatively happy.
The "calculator" or "Model selection" window demonstrated is attached in two forms to this post:
- As file Re-standardization window script.jsl:
- Running this script will open table Example.jmp invisibly. The user can make different selections of product + storage condition + QC parameter.
- When the window is exited, this will automatically close the data table used without saving.
- As table script inside Example.jmp:
- When the user runs the table script in this table, he/she will be able to observe how the calculator operates by adding new formula columns to the table. These columns are subsequently used for graphing.
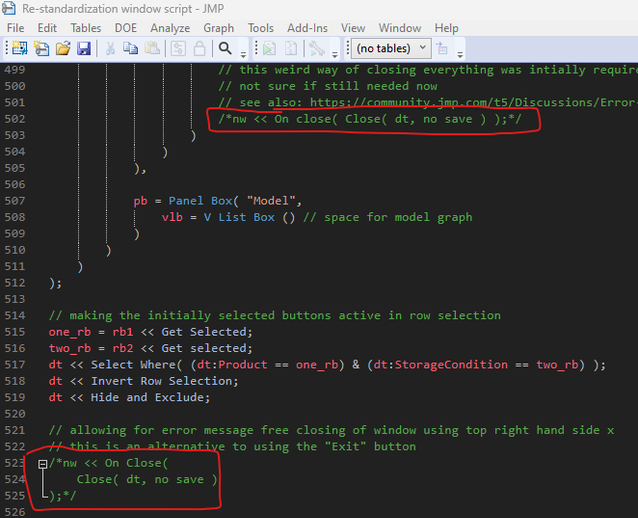
- The script is in the table almost as is, which means that closing the "Model selection" window will also close the data table (without saving). If the user wants to prevent the table from closing, the script in the table needs to be modified by commenting out the "On close()" parts as shown int he screenshot below.
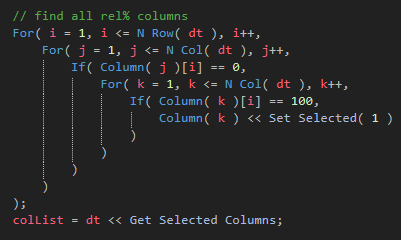
When looking at the table as well as the script, it is possible to adapt either to your individual needs, should you be interested. Note, that it is possible to have any number of relative columns in the table used by the script. (Check Optimizing a column formula for standardizing time resolved data to 100% rel. at t=0 for input on how to add relative calculations.) The script will find these columns by looking for all columns that have a value of exactly 100 for time = 0 using a For loop and nested If statements as shown in the screenshot below. The column names are then stored in a variable (colList) and used to populate the column list box in the "Model selection" window. The user may also add any number of products, batches or storage conditions as new rows to the corresponding columns. The script will automatically find these and populate the selection panels with the corresponding number of radio buttons. If the user wants to use the script directly on one of his/her tables, this is possible by copying the table script from Example.jmp to the user's own table, change the column names to fit the column names in Example.jmp and then execute the table script.
Important learnings from my perspective:
- Looping / using a For loop: Better way to select columns matching criteria in another column in same table?
- Updating display boxes: Updating Display Boxes | JMP Ahead (pega-analytics.co.uk)
- Updating column list boxes: Updating column list box using list stored in variable not working as expected. Is this how it is me...
- Using radio buttons, column list boxes, slide bars and buttons in general
- Using variables
- Use of the graph profiler for displaying any formula column (that was kind of a "wow" moment and I don't know why)
Any feedback you may have, any modifications or improvements of the script, I'd be happy to know.
It was a fun meeting and I hope to you see you again in 2024!
- © 2026 JMP Statistical Discovery LLC. All Rights Reserved.
- Terms of Use
- Privacy Statement
- Contact Us


