cancel
Showing results for 
Show  only  | Search instead for 
Did you mean: 
  • New to JMP? Join us Sept. 23-24 for the Early User Edition of Discovery Summit, tailor-made for new users. Register now for free!
  • Use World Cup data to build models, explore spatial relationships, and create informative visualizations in JMP. Register. July 17, 2 pm US Eastern Time.
  • Your voice matters! Tell us how you prefer to receive JMP updates, so we can tailor our communication to your needs. Take short survey.

New England JMP Users Group

Open to all JMP users in CT, MA, ME, NH, RI and VT
Choose Language Hide Translation Bar
hkplaisted
Visitor

Graph Builder: maximum value will not display with multiple Y axis

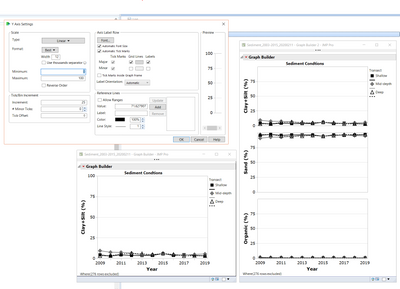
I would like to display multiple factors (Y-axis) in one window  (see image on right). However, the maximum Y axis value is always cut off (max Y = 100 in this case is cut off/not displayed). If I graph only one axis at a time (lower left image) the max value (100) will display. I cannot figure out how to display the maximum value on the multi-Y-axis frame (right side image). Does anyone know a solution to this problem?hkplaisted_0-1581518051008.png
 

0 REPLIES 0