cancel
Showing results for 
Show  only  | Search instead for 
Did you mean: 
  • New to JMP? Join us Sept. 23-24 for the Early User Edition of Discovery Summit, tailor-made for new users. Register now for free!
  • Use World Cup data to build models, explore spatial relationships, and create informative visualizations in JMP. Register. July 17, 2 pm US Eastern Time.
  • Your voice matters! Tell us how you prefer to receive JMP updates, so we can tailor our communication to your needs. Take short survey.

JMP Knowledge Base

Choose Language Hide Translation Bar
JMPで複数のROC曲線の比較やAUCの信頼区間の表示は行えますか?

JMP Pro 10以上では、ロジスティック回帰において、確率の計算式を保存して[モデルの比較]プラットフォームを用いることにより可能です。

実行例
下記のデータに対し、「(1)Y: 「Popid」、X:「alb」のROC曲線」、「(2)Y:「Popid」、X:「tp」」のROC曲線の2つを比較(いずれもPopid=1を陽性に指定)

stat3605_01.bmp


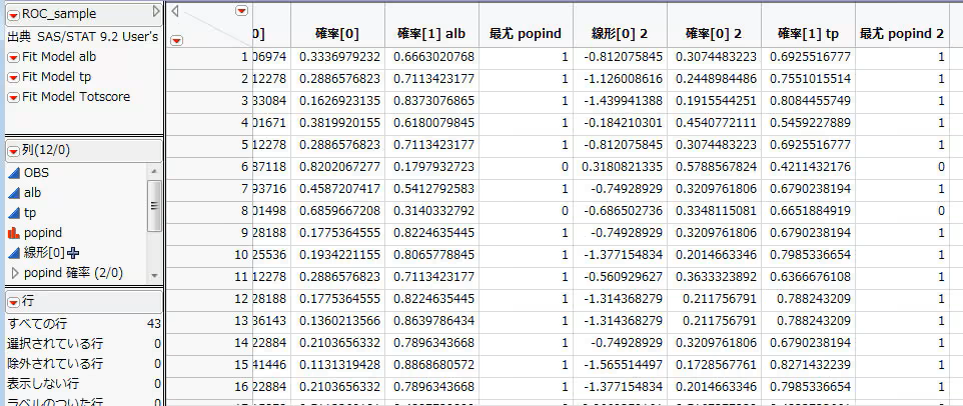
  1. (1)、(2)それぞれに対し、[二変量の関係]または[モデルのあてはめ]からロジスティック回帰を実行し、レポートの赤い三角ボタンから[確率の計算式の保存]を選択します (区別のために、確率[1]の列名を、「確率[1]alb」, 「確率[1]tp」と変更しています)。
    stat3605_02.bmp
  2. [分析]→[予測モデル]→[モデルの比較]を選択し、「確率[1]alb」、「確率[1] tp」を[Y,予測子]に指定して[OK]をクリックします。
  3. レポート「モデルの比較」の左上にある赤い三角ボタンから、[ROC曲線]、[AUCの比較]を選択します。stat3605_03.bmp

JMPでは、上記の[モデルの比較]プラットフォームは実行できないため、複数のROC曲線の比較やAUCの信頼区間の表示は行えません。


FAQ #3605

Details

Recommended Articles