EWMA and UWMA 管理図
σの推定値

![]()
![]()
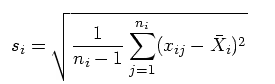
N は n i ≥2 となるサブグループの数、 s i は i 番目のサブグループのサンプル標準偏差です。
![]()
![]()
![]()
![]()
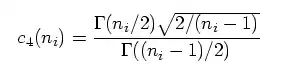
ここで ![]()
 はガンマ関数を表し
![]()
 は i 番目のサブグループ平均を示します。
![]()
![]()
サブグループの標準偏差 s i は、 n i ≥ 2.のときに限り計算に含めることができます。
オブザベーションが正規分布に従うとき、 s i の期待値は c 4 (n i )σ になります。
したがって、 は N 個の σの不偏推定値の単純平均です。
![]()
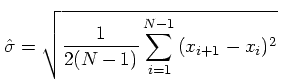
各々のサブグループのサンプル数が1 ( n i =1) のとき、σのプロセス標準偏差は、以下の式で推定されます。
![]()
![]()
ここで N はオブザベーション数を示し、 x i ,x 2 ,...,x n は個々の測定値を示します。