Xbar-R 管理図
σの推定値
![]()
![]()
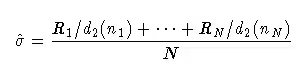
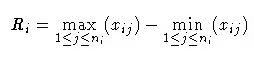
N は n i ≥2 となるサブグループの数、 R i は i 番目のサブグループ x i1 ,...,x in i のサンプルレンジ(範囲)です。
![]()
![]()
Xbar-S 管理図
σ の推定値

![]()
![]()
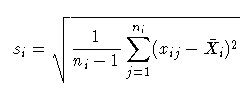
N は n i ≥2 となるサブグループの数、 s i は i 番目のサブグループのサンプル標準偏差です。
![]()
![]()
かつ
![]()
![]()
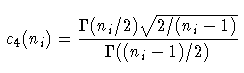
ここでΓ(·) はガンマ関数を示し、 X-bar i は i 番目のサブグループ平均を示します。
IR 管理図
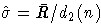
σ の推定値は、
![]()
R-bar は移動範囲の平均。
n は移動範囲を計算するために用いられる連続した個々の測定値の数。
d 2 (n) は母標準偏差が1である n 個の独立した正規分布に従う確率変数の範囲の期待値です。
補足
d 2 (n) とは、移動平均の区間 n によって決まる値で、以下の数値になります。
d 2 (2) =1.1283791671
d 2 (3) =1.6925687506
d 2 (4) =2.058750746
d 2 (5) =2.3259289473
d 2 (6) =2.5344127212
d 2 (7) =2.7043567512
d 2 (8) =2.8472006121
d 2 (9) =2.9700263244
d 2 (10) =3.0775054617
![]()
![]()