Dynamically Change Graph Builder Chart Type Depending on Variable Modeling Type
Created:
Dec 8, 2023 03:56 PM
| Last Modified: Dec 12, 2023 5:47 AM

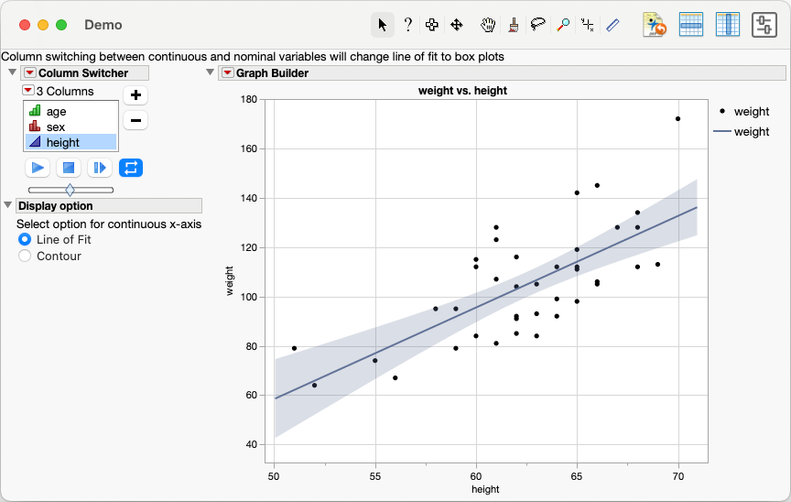
This recipe shows how to change the element type in Graph Builder dynamically, depending on whether the user selects a continuous or categorical x-axis variable in the Column Switcher. Elements are the graph types that appears as icons at the top of the Graph Builder palette. For continuous inputs, a radio button is added letting the user select between a Line of Fit and Contour. This recipe is useful when creating interactive charts for people who are not JMP experts and only need a limited number of options.
Ingredients:
- Graph Builder
- Expression Handling
Sample Data Table – Big Class
Difficulty – Hard
Steps
- Start with Names Default to Here(1) and open Big Class.
Names Default To Here( 1 );
dt = Open( "$SAMPLE_DATA/Big Class.jmp" );
- Create a function which sends a message to the Graph Builder platform that removes the existing element then adds a new one. It assumes that the Points element is already displayed and is element number 1, therefore the element to be removed is number 2.
// This function changes the type of chart being displayed.
// It takes a reference to a Graph Builder report (gbr) and the chart type required (gr)
// At the moment it assumes the Points element will always be included
changeElement = function( {gbr, gr},
	{default local},
	Eval(
		Substitute(
			Expr(
				gbr << remove element( 1, 1, 2 ) << add element( 1, 1, {Type( __aa__ ), X, Y} )
			), Expr( __aa__ ), gr
		)
	)
);
- Create the new window which contains the column switcher (cs) to change the x-axis, a radio box (rb) to control the element type for continuous variables, and the Graph Builder (gb).
rb_out = "Line of Fit";
win1 = New Window( "Demo",
	Text Box(
		"Column switching between continuous and nominal variables will change line of fit to box plots",
		<<set wrap( 1000 )
	),
	H List Box(
		V List Box(
			cs = dt << column switcher( :height, {:age, :sex, :height} ),
			Outline Box( "Display option",
				Text Box( "Select option for continuous x-axis" ),
				rb = Radio Box(
					{"Line of Fit", "Contour"},
					rb_out = rb << get selected();
					if( Column( dt, cs << get current ) << get modeling type == "Continuous",
						changeElement( Report( gb )[GraphBuilderBox( 1 )], rb_out )
					)
				)
			)
		),
		gb = dt << Graph Builder(
			Size( 534, 454 ),
			Show Control Panel( 0 ),
			Variables( X( :height ), Y( :weight ) ),
			Elements( Points( X, Y, Legend( 3 ) ), Line Of Fit( X, Y, Legend( 5 ) ) )
		)
	)
);
The column switcher is deliberately created outside the Graph Builder so we can later create a function to take action when the switcher changes.
- Link the column switcher cs to the Graph Builder gb
cs << link platform( gb );
- Create a Column Switch Handler. The function post is called by the handler once the change has been completed. The format comes directly from the Scripting Index.
post = Function( {previousColumn, currentColumn, switcher},
	gbr = Report( gb )[GraphBuilderBox( 1 )];
	If( Column( dt, cs << get current ) << get modeling type == "Continuous",
		changeElement( gbr, rb_out ),
		changeElement( gbr, "Box Plot" )
	);
);
cs << Make Column Switch Handler( 1, post );
Note that nothing needs to happen before the switch is completed, so the first argument of Make Column Switch Handler does nothing.
- Finally, start the column switcher running for demo purposes.
cs << run();
Potential variation:
- Create a "pre" change function which iterates over the existing elements in the Graph Builder (using << Get Elements), finds the one that needs to be removed and programmatically sets the third argument in << remove element (rather than relying on it being the second element).