Quality by Design (QbD) has been emphasized by international regulatory agencies for more than 10 years as a risk-based, flexible approach to meeting regulatory requirements. It is true that QbD provides detailed evidence of compliance; however, it is only a small portion of the value that comes from the approach. JMP provides excellent design of experiments (DOE) and modeling tools that can involve QbD practices to provide value throughout the life cycle of pharmaceutical and medical device products.
A product development team used the DOE Custom Designer in JMP to develop a 12-run response surface design for four process inputs of the high shear granulation process. The granulations were tested for physical properties, and a sample of each granulation was compressed into slugs so core disintegration time could be tested. The Granulation Process Experiment Results Simulation.jmp data table for the experiments is shown in table 1 below and can be accessed via https://support.sas.com/lievense.
Table 1 - Granulation Experiments with Results

My book, Pharmaceutical Quality by Design Using JMP, includes several examples including the example detailed in this blog. The data were entered directly into the JMP DOE file as the runs were completed, which allows for fast analyses by running the Model script. Reducing the model to include only significant effects results in improved precision for estimating the amount of leverage each effect has on the outputs shown in Figure 1.
Figure 1 - Reduced Model Effects

The Prediction Profiler, shown in Figure 2, is an incredible tool for product developers to fully explore the process design space without expending resources creating physical granulations and testing them.
Figure 2 - Profiling the Reduced Granulation Model

Prior to using the model profiler, the simulator analysis option is chosen and expected specification limits for the outputs are set (Figure 3).
Figure 3 - Simulator Settings

Knowledge about the general shape and extent of the variability add robustness to model estimates. Subject matter experts (SME) provide a range of actual results expected for process settings that are within the design space. SMEs noted that variation in inputs tend to vary equally above and below the set point; therefore, it is reasonable to assume that each input varies following a normal distribution. The standard deviation for each input is estimated by dividing the reported range of values by 6. Table 2 is the result of research into the process variables.
Table 2 - Historical Variation in Process Inputs

The example data has a script to run the model analysis with the simulation settings noted. JMP can be used quickly and efficiently during meetings to illustrate predictions of the operational population of batches. The operations team would prefer to run the granulation process with a spray rate of nine gallons per minute, 30% fluid added, 45 RPM impeller speed, and a wet mass time of 11 minutes. Figure 4 includes the preferred settings with the Simulate button pressed, creating 5,000 model simulated runs.
Figure 4 - Planned Process Settings and Results

JMP illustrates the expected granulation results, which yield 76% of runs that do not meet at least one of the output specifications. The particle size distribution 50th percentile size [PSD d(0.5)] is the output where nearly all of the defects occur due to oversized particles. The operations preferred settings will not work well at all.
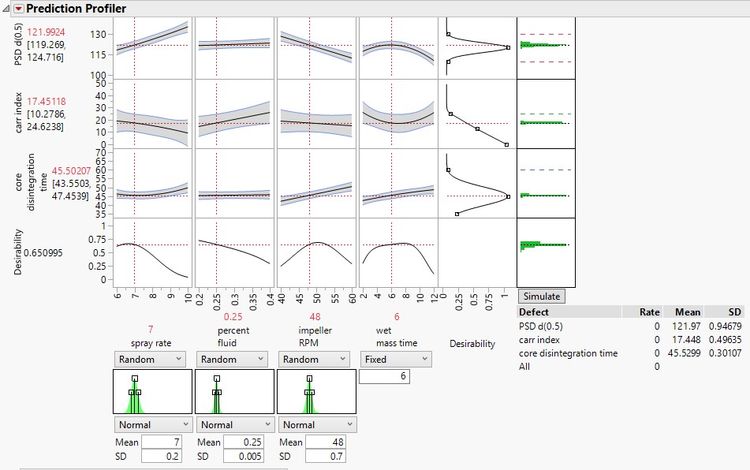
A new set of preferred processing input values are used. The Profiler is adjusted to reflect the new settings and simulate a new set of 5,000 runs as shown in figure 5.
Figure 5 - Optimized Settings and Results

The expectation for defects is 0 since the 95% confidence intervals for the outputs, shown in black values, are within the specifications. The Prediction Profiler with the simulator adds a huge amount of value for product and process development. Products developed with these value-added QbD techniques tend to reach the market up to 70% faster with a 50% reduction in resources used. Use of Profiler simulations to make predictions of the future operational performance illustrates the most robust process possible.
You must be a registered user to add a comment. If you've already registered, sign in. Otherwise, register and sign in.