JMP 13 introduced a host of exciting new features to JMP customers. One of the most highly anticipated features was the Text Explorer platform, which allows analysts to understand the structure of text data. The buzz around Text Explorer is certainly justified as the platform has the potential to reveal objective insight from a multitude of text entries that would otherwise be impossible for an individual to detect (especially when the analysis involves thousands or millions of text sources).
As JMP customers continue to take advantage of Text Explorer, the JMP development team has made efforts to simplify the use of the platform and improve interpretability of results. These improvements focused specifically in Latent Semantic Analysis and Topic Analysis and are available in JMP Pro 13.2. In this post, I outline these efforts and emphasize how the changes facilitate analysts' use and interpretation of the Text Explorer platform.
A Transformation
Latent Semantic Analysis and Topic Analysis are two approaches for analyzing text. Previously, these analyses were carried out in JMP through a singular value decomposition (SVD) of the “Centered and Scaled,” “Centered,” or “Uncentered” document term matrix (DTM). The DTM is a matrix derived from your text data, which summarizes the number of terms within and across text documents. The SVD on the DTM led to insightful results, allowing JMP Pro users to identify key dimensions (aka singular vectors) underlying their text data and values that describe the meaning of such dimensions (aka term or document singular vectors).
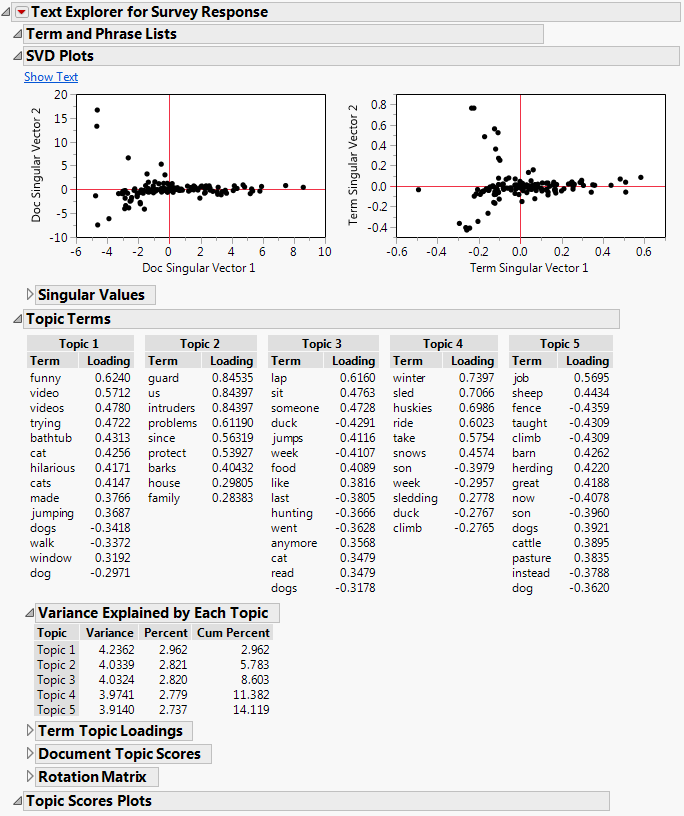
 Figure 1. The new look of Latent Semantic Analysis and Topic Analysis, with more intuitive labels and values.
A key improvement in the platform – implemented in 13.2 – consisted of doing the SVD of the “Centered and Scaled” or “Centered” DTM divided by N-1 (N = total number of rows in DTM), or just N if users select the “Uncentered” scaling option. Importantly, dividing the DTM by a constant (N-1 or N) doesn’t change the pattern of results in the platform, but it does make the resulting estimates much more interpretable.
Improved Interpretability
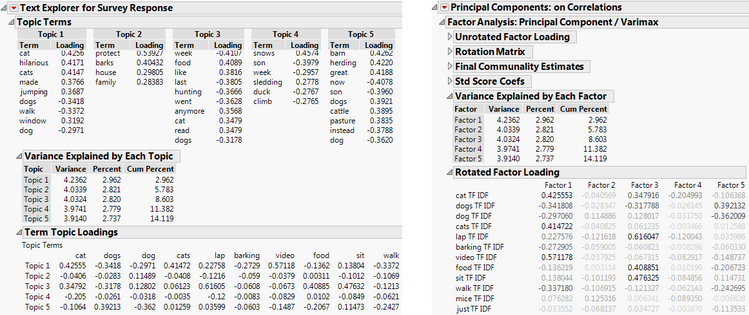
Thanks to the DTM being divided by N-1 or N, Latent Semantic Analysis is now identical to Principal Components Analysis (PCA). Similarly, Topic Analysis is now identical to a Rotated PCA (see Figure 2 for select output from both platforms). Thus, Term Singular Vectors are now identical to Loadings in a PCA context, and are consequently labeled “Term Topic Loadings.” When users select “Centered and Scaled” as the scaling option in Text Explorer (which is the default), results are identical to a PCA of a correlation matrix. Similarly, when “Centered” is chosen, the results parallel those of PCA of a covariance matrix, and when “Uncentered” is selected, the results will be just like PCA of an unscaled matrix.
 Figure 2. Side-by-side comparison of Topic Analysis and Rotated Principal Components Analysis, which can be accessed through the "Factor Analysis" option in the Principal Components platform.
Why are these changes exciting?
Are you familiar with PCA? You can now translate everything you know about PCA into text analysis. Here are some examples:
- Selecting the best number of topics: All guidelines from PCA can now be used to select an appropriate number of topics. For example, looking for the elbow on a scree plot of squared singular values (aka eigenvalues), or summing up the percent of explained variance of squared singular values until achieving a reasonable percentage, or other method of choice.
- Understanding the importance of topics: What used to be called “Topic Portions” is now “Variance Explained by Each Topic.” The values are the same but now the interpretation of the values is more intuitive. If your first topic explains 40% of the variance in your data, then you know this topic is very relevant in your documents.
- Interpreting the meaning of a topic: When “Centered and Scaled” or “Centered” are selected as the scaling options (recall these are equivalent to PCA on Correlation and on Covariances, respectively), Topic Term Loadings represent the correlation of the particular term with the underlying topic. Thus, high values (approaching 1) point to a term that’s very characteristic of the topic.
- Deriving new variables for further analysis: Just like you can compute component scores in PCA to take to secondary analyses, you can compute Document Topic Scores (previously labeled Document Singular Vectors), which contain the vast majority of information in your DTM but in a much more concise structure.
The Rosetta Stone
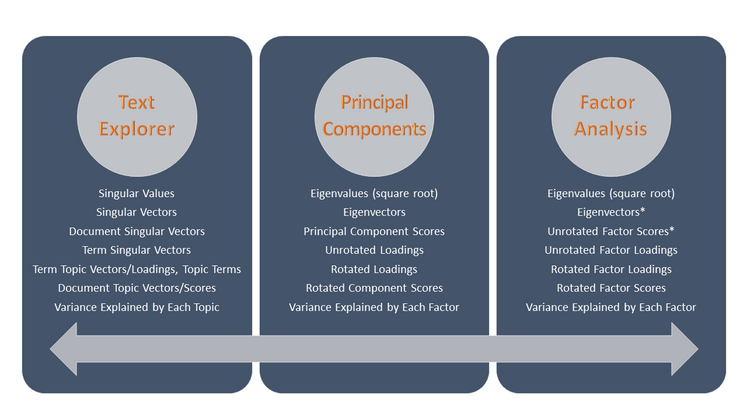
To further facilitate the translation between Latent Semantic Analysis/Topic Analysis and PCA/Rotated PCA, I created the following illustration, which I call the Rosetta stone of Text Explorer (as in the Egyptian stone that helped historians understand hieroglyphs). I include panels for the Text Explorer and PCA platforms with keywords used in reports that have equivalent meaning, and I include a panel for Factor Analysis because a special case of Factor Analysis is identical to Rotated PCA (the case of communalities == 1, see my post on this topic).
 Figure 3. The Rosetta stone of Text Explorer, Principal Components, and Factor Analysis platforms. Keywords in each panel are equivalent to those in the same row of other panels. *Not available in the platform as these aren’t normally used.Figure 3 helps one see how the lingo from one platform relates to the jargon of the other.
So don’t delay to update to JMP Pro 13.2 and take advantage of this and other improvements to JMP!
You must be a registered user to add a comment. If you've already registered, sign in. Otherwise, register and sign in.