JMP has long been a leader in providing the statistical tools needed by engineers and technicians to measure and analyze variations in the quality of products and the processes that produce them. These tools include:
- Control charts provide feedback on key variables and show when a process is in, or out of, statistical control. The Control Chart Builder platform provides an interactive, point-and-click, drag-and-drop tool for developing industry-standard control charts.
- The Process Capability platform measures the ability of a process to meet specification limits. You can compare process performance, summarized by process centering and variability, to specification limits. The platform calculates capability indices based on both long-term and short-term variation. The analysis helps identify the variation relative to the specifications, which enables you to achieve increasingly higher conformance values.
- The Process Screening platform enables you to explore many processes across time. The platform calculates control chart, process stability, and process capability metrics, as well as detects large process shifts.
- The Measurement Systems Analysis platform assesses the precision, consistency, and bias of a system. Before you can study a process, you need to make sure that you can accurately and precisely measure the process. If variation comes from the measurement itself, then you are not reliably learning about the process.
- Variability Gauge Charts analyze continuous measurements and reveal how your system is performing. Attribute Gauge Charts analyze categorical measurements and show you measures of agreement across responses. You can also perform a gauge study to see measures of variation in your data.
When you add JMP Live to the mix, however, you can take quality and process control to the next level in your organization. JMP Live is a web-based application installed on-site at your company, so any of the analyses that you create and publish to JMP Live can now be visible to anyone in your organization who needs to see them. You can leave comments on an analysis, mentioning other people, which will immediately draw them into any conversation that you need to have.
For example, with control charts, JMP Live gives you the ability to triage out-of-control points, assign them to responsible parties, and follow the process through the investigation of the issue right through to its resolution.
Prefer video? Watch it here.
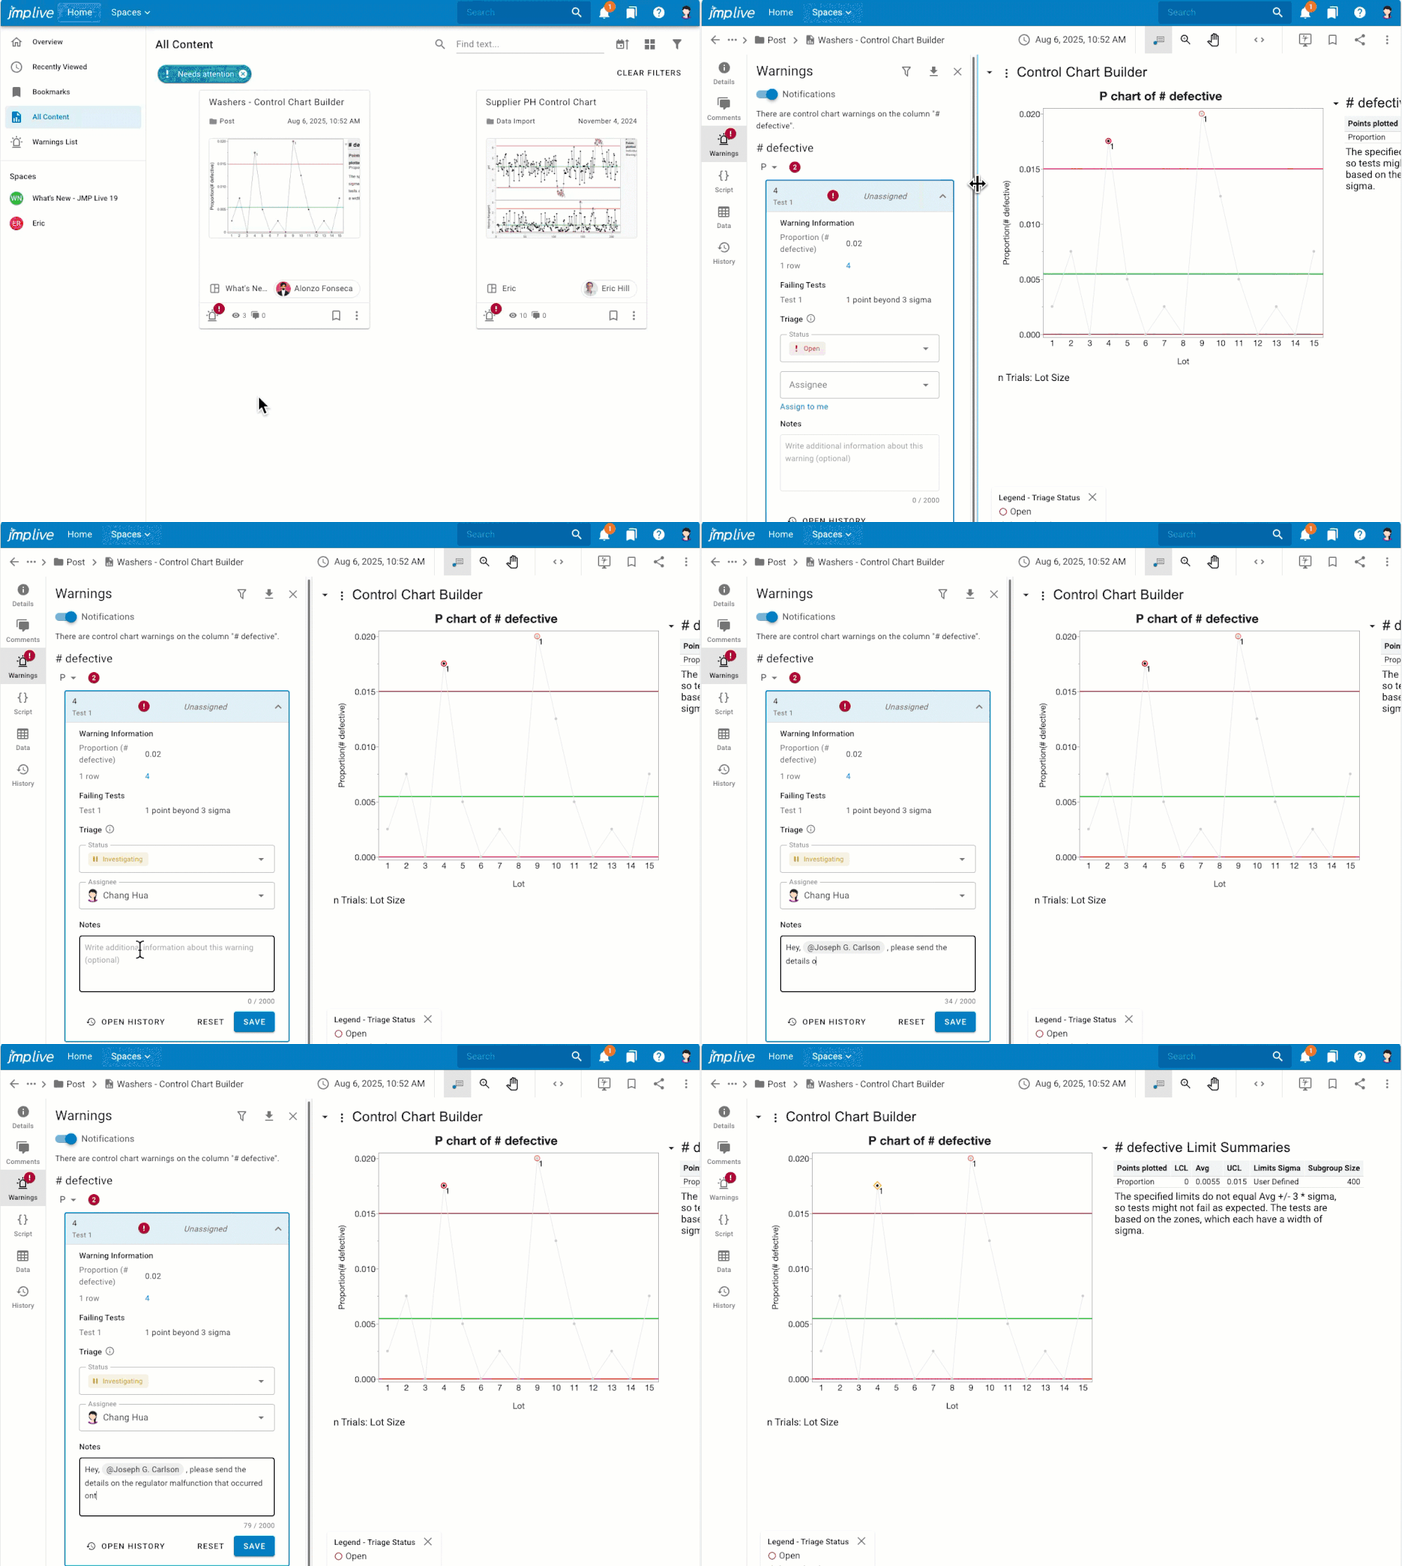
Here is an example of a control chart with two out-of-control points. Chang Hua notices the issue on her dashboard, visits the control chart, and begins the triage process. She assigns it to herself, changes the current status to Investigating, and leaves a note that @mentions her colleague Joseph Carlson, requesting information that may help explain what happened.

Figure 1: Control chart with warnings being triaged
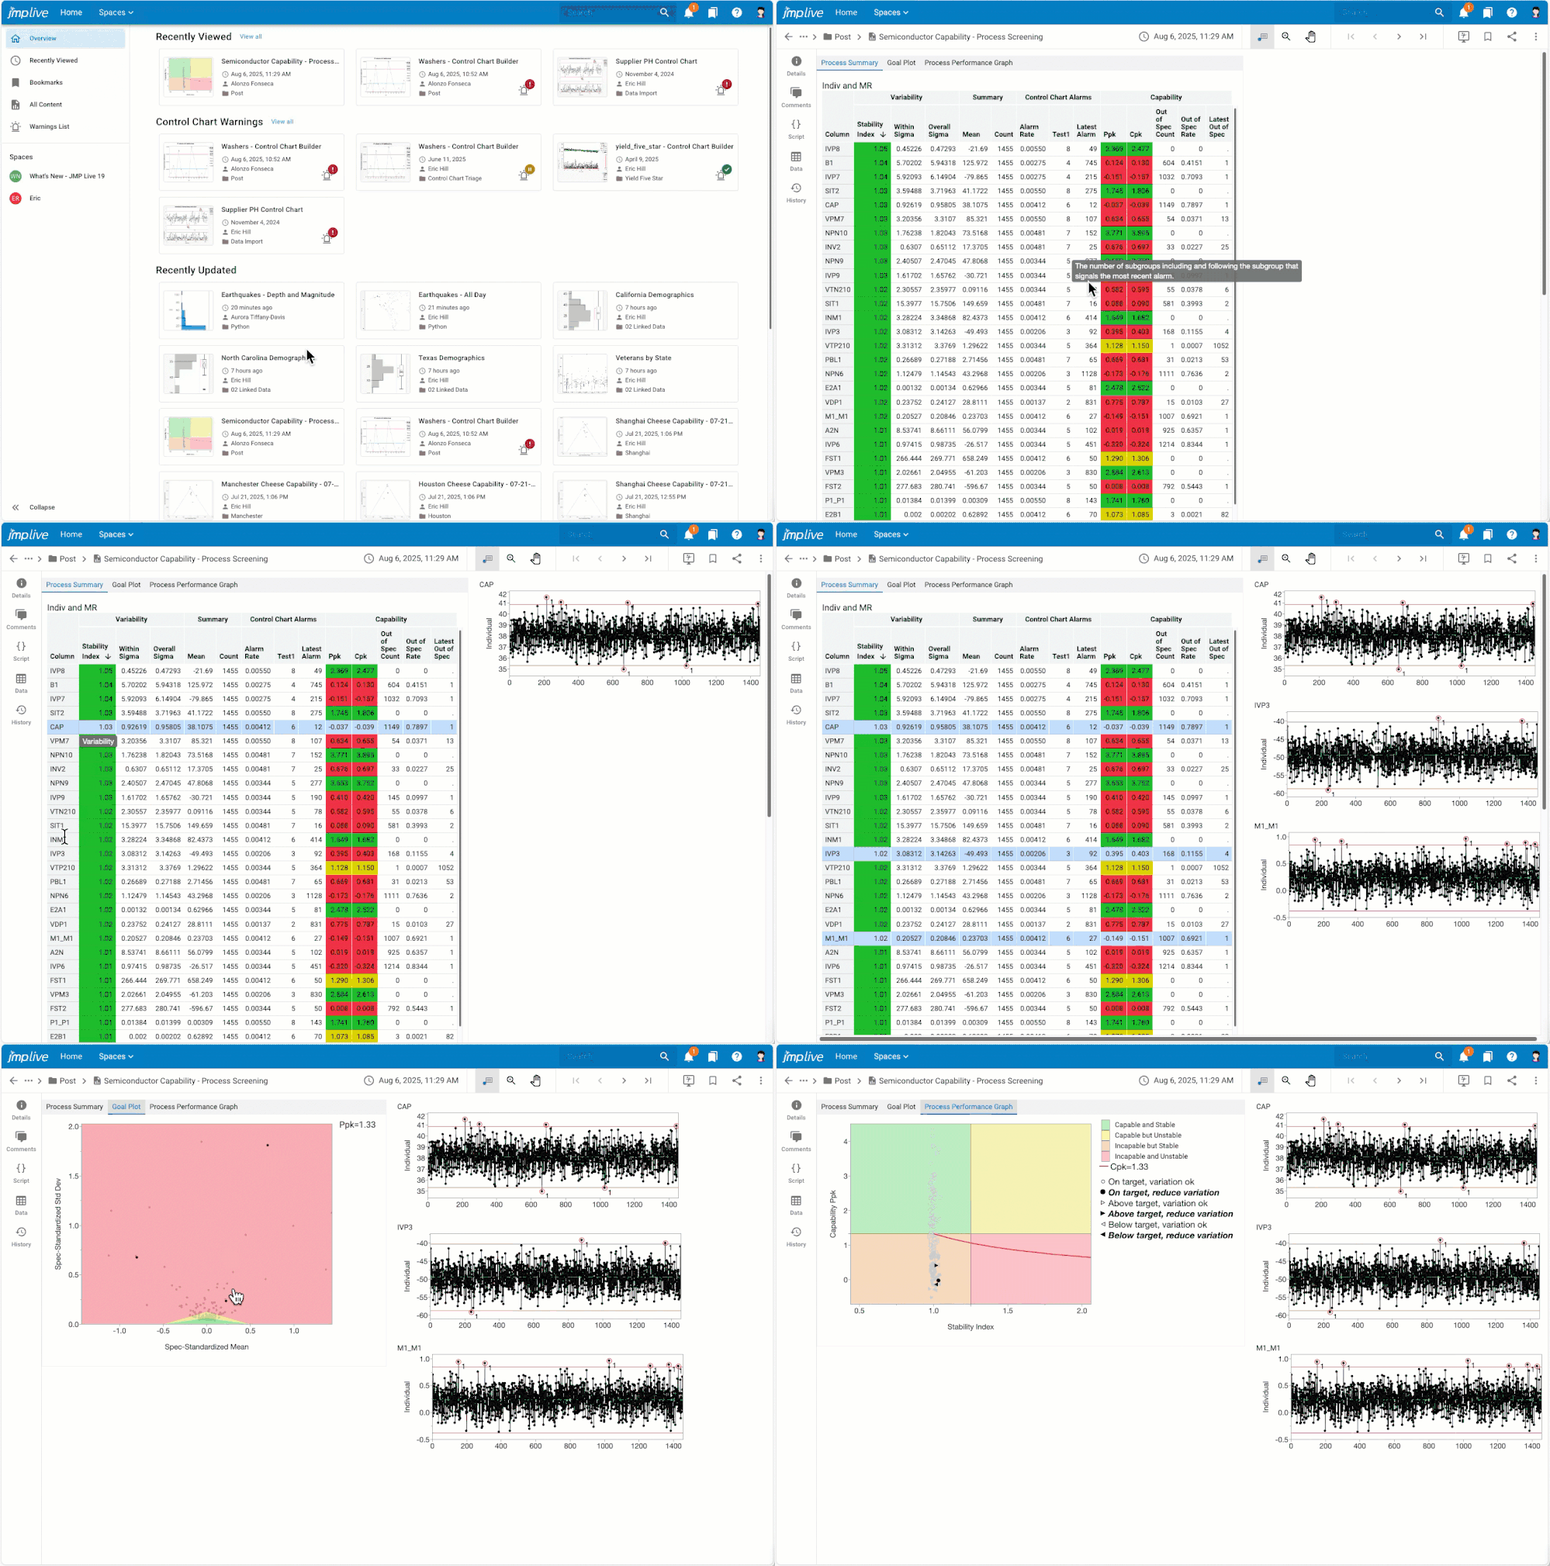
Another platform in the JMP quality suite that has been enhanced for JMP Live is Process Screening. Process Screening allows you to explore the behavior and capability of a large number of processes at once and across time. When you publish your Process Screening analysis to JMP Live, you can dig deeper into processes of interest by viewing and comparing their control charts.

Figure 2: Process Screening in JMP Live, showing control charts for selected rows
Switching to the Goal Plot tab of the published Process Screening report allows you to see the control charts for the selected processes, along with where they are on the goal plot. You can select points on the goal plot to show the corresponding control chart. The Process Performance Graph is also available on a separate tab.
Your use of JMP for quality and process control is greatly enhanced when you incorporate JMP Live, so be sure to request a demo of JMP Live if you think it could help you and your organization.
You must be a registered user to add a comment. If you've already registered, sign in. Otherwise, register and sign in.