Three-way charts were introduced in Control Chart Builder in JMP 10. You can read about this type of chart in my colleague Annie Zangi's blog post “Three-way charts, an evolution of the Presummarize Control Chart.” We are happy to be able to say that in JMP 14, you can also get a three-way chart in two other platforms. The three-way chart is now also available in Process Screening and Process Capability.
As an example, consider a vial fill process in a pharmaceutical company. There is a large complex machine that fills vials in a super clean room. To fill the vials, the machine uses a set of four needles to fill a block of four vials. Once the vials are filled, they are stoppered and sent out of the clean room into another room. In the second room, the fill weight of the vials is tested at regular intervals throughout the day. The target fill weight is 6.1 grams per vial. If the vial fill weight measures below 5.8 grams, the vial will have to be thrown out. We have last week’s production data for the company's Drug Z 10 dose vials. Twelve samples were tested per day with six vials per sample. Let’s take a quick look at the data using the variability chart to see the different types of variation we expect to see.
Variability Chart
Open Vial Fill Weights, which is provided with JMP sample data, and run the Variability Chart script.
dt=Open("$SAMPLE_DATA/Quality Control/Vial Fill Weights.jmp");
dt<<Run Script("Variability Chart of Fill Weight by Sample");
 Variability chart for vial fill weights
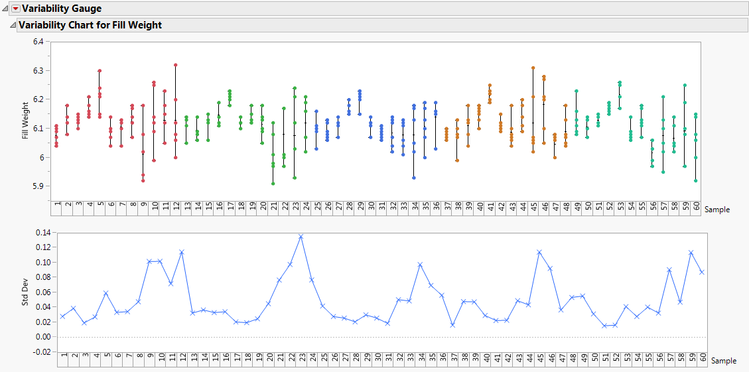
Notice the within variation. Every sample does not yield vials with the same fill weight. The range bar for sample 12 shows a wide variation in the fill weights of the six vials. Notice the between variation. All bars are not equal length or in the same location. The range bar for sample 41 is much higher than the range bar for sample 56. The data has been colored by Day. Notice the pattern that appears with days. It looks like the measurements tend to go up at the beginning of the day, and then the measurements fall somewhat, but the ranges tend to get much larger at the end of the day. Given the nested design, we expect to have variation between samples as well as within samples. We will therefore need a three-way chart to analyze this data.
Process Screening
To create a three-way chart in Process Screening, use the following steps.
- Select Analyze->Screening->Process Screening.
- Select Fill Weight in the Select Columns panel and click Process Variables.
- Select Sample in the Select Columns panel and click Subgroup.
- For Control Chart Type, select XBar MR and S.
 Process Screening Dialog
 Process Screening reportThe results give four estimates of sigma.
- Within sigma is the estimate of variation within samples.
- Overall Sigma is an estimate of the overall variation which does not depend on subgroups.
- Between sigma is an estimate of the variation between samples.
- Between-and-Within Sigma is an estimate of the combined variation of within a sample and between samples.
We notice for this example that the within sigma (0.05256) is slightly higher than the between sigma (0.03332). The Between-and-Within Sigma (0.06223) is very close to the Overall Sigma (0.06993).
The Stability Ratio and Cpk are calculated using the Between-and-Within Sigma estimate.
Process Capability
We could produce a three-way chart in Process Capability by selecting the process in the Process Screening platform and choosing Process Capability for Selected Items. Let’s instead see how to produce a three-way analysis using the Process Capability dialog.
- Select Analyze->Quality and Process->Process Capability.
- Select Fill Weight in the Select Columns Panel and click Y, Process.
- Open the Process Subgrouping panel.
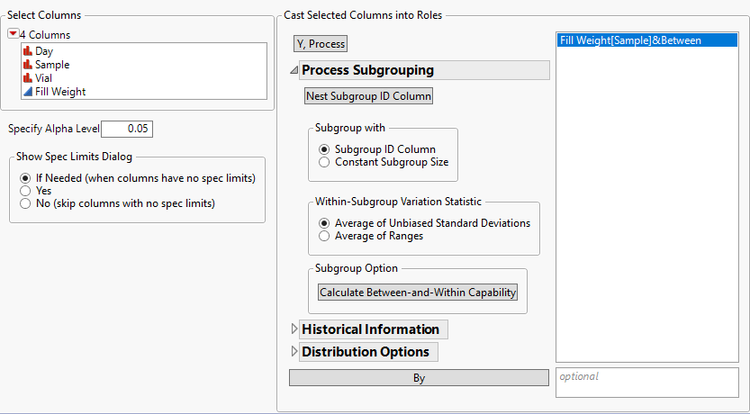
- Select Sample from the Select Columns Panel, Fill Weight in the Cast Selected Columns into Roles panel and click Nest Subgroup ID column.
- Click Calculate Between-and-Within Capability.
 Process Capability Dialog
From the red triangle next to Process Capability, choose Individual Detail Reports.
 Process Capability Report
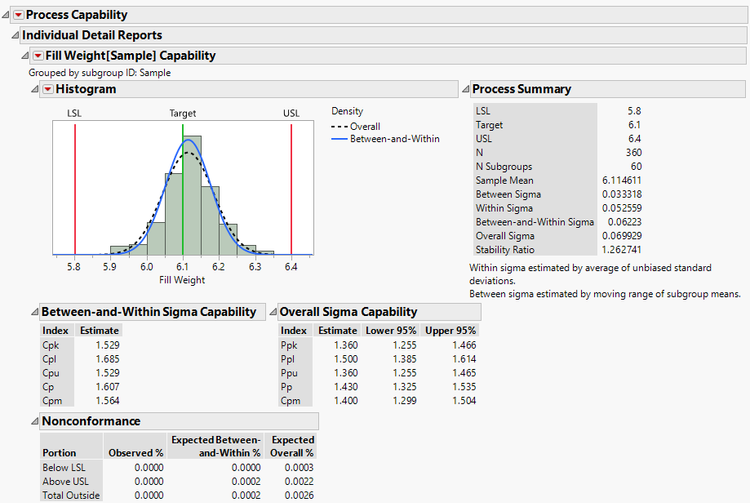
In the Process Summary section, you will notice the same four estimates of sigma that you saw in the Process Screening platform. You will also find capability statistics based on the Between-and-Within Sigma as well as capability statistics based on the overall sigma.
We see from the histogram that the process is slightly above target. All vial fill weights are within the given specification limits. This process is capable.
Three-way charts in three platforms
Beginning with Version 14 of JMP, three-way charts are available in three different platforms: Control Chart Builder, Process Screening, and Process Capability. This means that, as the user, you have multiple ways of analyzing the same information — that is, you can pick the platform that best suits your needs.