To bring the same interactivity to the web that customers are used to in JMP, data must be exported along with code to create rich graphics in Interactive HTML. We warn customers that sharing Interactive HTML reports does put their data out on the web, but as more and more JMP features are added to the output what you might not realize is that the size of these files has also continued to grow. Only a portion of the output is the data, with additional content needed to present the tables, text and images you see on the screen.
In JMP 13, with the addition of Graph Builder and now with data filters in JMP 14, increasingly larger portions of the data table are embedded in the HTML output. To manage file size, we introduced a couple of new features in JMP 14.1: compression and the ability to save without data.
Compressing the data
First, compression is applied to just the data of the reports. Results vary based on the type and content of the data; repetitive string data compresses the best, and random numeric data compresses the worst. Benchmark data sets have shown that for some platforms, little or no reduction in output size occurs, but platforms such as Graph Builder can see up to a 68% reduction in the size of HTML files. We have made an exception for very small data sets (less than 50 rows) where the file size is already small. This happens automatically without requiring you to set a preference.
Not publishing the data
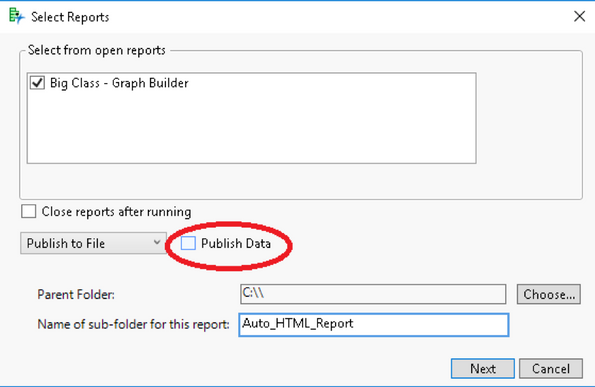
The second feature can be useful if you want to prevent data from being exported, but still want to capture some results in a web friendly format. In JMP 14, you can Publish multiple Interactive HTML reports with the Publish menu option under File. New in 14.1 is an option to not publish the data, by unchecking the Publish Data checkbox on the Select Reports dialog:
 Figure 1: By unchecking the Publish Data checkbox, no data will be exported, just static images.
This will result in a report with the styling of Interactive HTML pages – collapsible sections, tables with hover labels, etc., but all charts will be static images. This can be useful for a very large data set where you want to display a few charts, but do not want to output thousands of rows in text format. Please note that if there are too many static images, or their dimensions are too big, you could end up with a file that is large anyway. This works best for a couple of small graphs on a very large data set.
A few more tips
Another question we get asked often is: “How do I make my Interactive HTML output smaller?” So I’d like to share a few tips and strategies for generating interactive graphs and minimizing their size. Simply avoid exporting any data you don’t need.
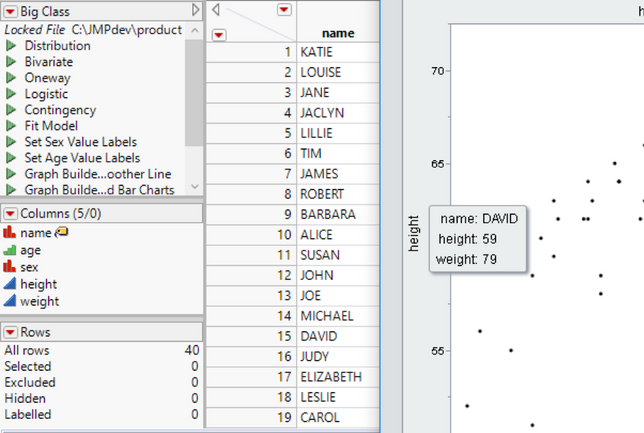
- Labelled columns – Labeling a column in JMP is great because it will make the column appear in the tooltips provided by Interactive HTML, allowing you to explore additional information about an observation without access to the full data table. However, it means an additional column is being exported that wouldn’t be needed otherwise if it is not assigned to a visual role in the graph. If you don’t care about seeing it in the tooltip, unlabel it by right-clicking on the column name in the JMP data table and select “Label/Unlabel” to save the space.
 Figure 2 : Height and weight columns are needed in the data section since they are Y and X respectively, but name is labelled only to make it appear in the tooltip. Unlabel it if knowing the name associated with each point is not important to your audience.
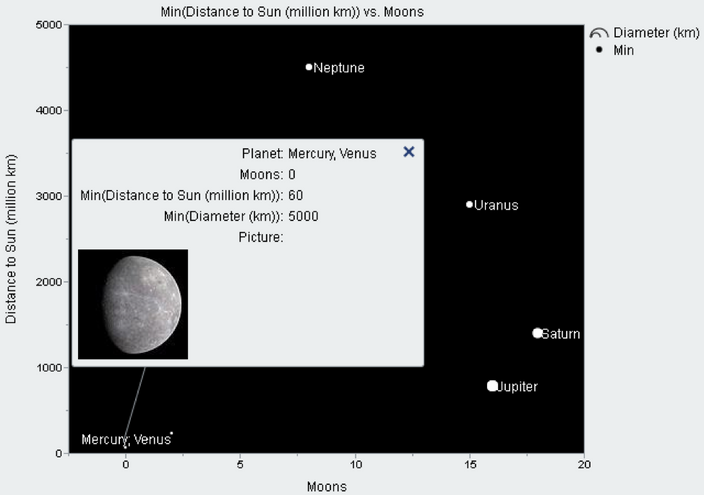
- Images – Image columns can look impressive in your tooltips especially if they provide value, but if it is a graph that doesn’t support image tooltips, leave out these columns. As of JMP 14.1 only markers, lines, heatmap, maps, and bubble plots support displaying images in their tooltips. While unchecking Publish Data can save you from exporting your data, the graphs will all become static images, and too many images in your Interactive HTML output can make the file large as well. Further, if an unsupported feature comes out as an image, think about if it truly brings value to the viewer or if there is a way to just turn off that part of the report through the red triangle menu or in your JSL script before exporting.
 Figure 3: Markers are one of only a few visual elements that will display images in their tooltips. Do not include or label image columns if you don't want to display them or the graph type doesn't support them.
- Data Subsets – There are various ways of breaking up your data in JMP to see only a portion it at a time. However, if you want to be able to filter on the data, the entire data set must be exported. For example, if you have a data set with 10,000 rows and create a graph using a where clause that displays 100 rows, you still export all 10,000 rows. If you are truly only interested in those 100 rows with no intention of having the viewers of the report filter or view the remainder of the data set, it would be better to create a subset of your data with “Link to original data table” disabled before you create the graph.
We’ve heard your concerns and taken a step to shrinking the size of our interactive HTML output. The tradeoff in interactivity and new functionality is worth the size. Explore the many platforms supported at our Interactive HTML Examples page.
You must be a registered user to add a comment. If you've already registered, sign in. Otherwise, register and sign in.