Traditional Shewhart Control Charts are well-established in detecting sudden spikes, large shifts (say, greater than 3 * σ), and some specific patterns or runs in a process. However, when small shifts are important to detect, traditional control charts fail to spot them.
It’s well-established that CUSUM charts are effective at detecting small shifts; still the CUSUM V-mask can be hard to interpret, and it is often difficult to determine meaningful starting values. The new CUSUM Control Chart in JMP does away with the V-mask and uses all available information to provide reasonable starting parameters.
In this blog post, I show an example of when a small shift is important, yet nearly invisible to the traditional control charts, and how to use the CUSUM Control Chart, new in JMP 14, to identify the shift.
This example examines data from a car engine thermostat. The engine was designed to operate in a temperature range of [90o C, 110o C], with a target temperature of 100o C. While a small variation is normal, signals from the thermostat tell the controller when the engine temperature has shifted up, so the cooling system can respond quickly and bring the temperature back into the optimal operating range.
Individuals and Moving Range chart
- Open Engine Temperature Sensor.jmp, found in the Quality Control Folder
- Choose Analyze->Quality and Process -> Control Chart Builder
- Drag Y to the Y drop zone
- Right-click on the graph and choose Warnings->Tests->All Tests
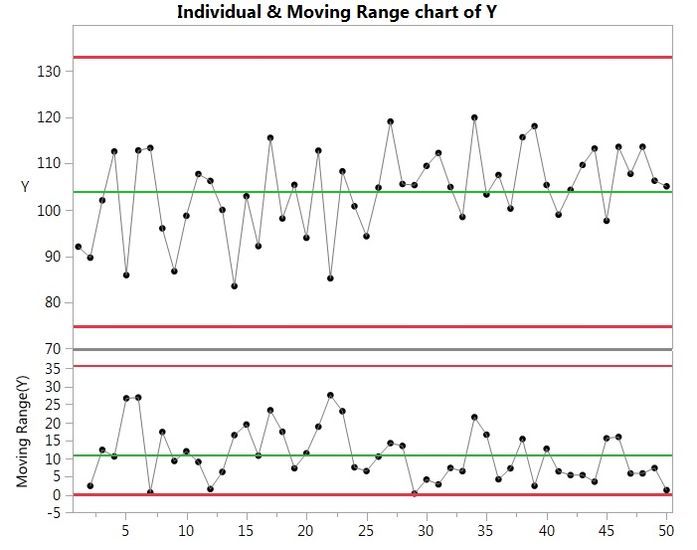
 Figure 1. Traditional Shewhart Individual and Moving Range chart of temperature
In this chart, we see no tests flagging, including the runs tests. Nothing appears out of control or out of the ordinary.
Why do we want to detect small shifts? The cooling system is designed to efficiently gradually lower the temperature. If the temperature rises too high, it may not be able to bring the temperature back down to a safe operating level fast enough. And, it’s inefficient for the cooling system to cycle on and off briefly every time the temperature changes by a few degrees. Short of an emergency like an explosion or severe loss of pressure, we’re not likely to see a sudden spike in engine temperature.
CUSUM Background
The CUSUM chart plots the cumulative deviations between each data point and the target or reference value, µ.
 Hopefully, it’s clear that because the CUSUM upper and lower points (C+ & C-) are the sum of the accumulated prior deviations, this type of chart is uniquely able to identify even small shifts quickly.
As the new CUSUM Control Chart platform uses the methods also called “Decision Limits” or “Tabular CUSUM”, with some algebra, we are able to make the limits horizontal and set to H, which makes the results and interpretation similar to traditional control charts rather than trying to interpret a V-mask,.
CUSUM Control Chart
- Choose Analyze->Quality and Process -> CUSUM Control Chart
- Specify Y as the Y variable, then click OK
- If not already selected, check the Lower Side Box
 Figure 2. CUSUM Control Chart of temperature with default values
Note the Target defaults to the average of the data, 103.963, and the Sigma defaults to the standard deviation, 10.9792. Because the parameter, k, also called ‘slack’, defaults to 0.5, the minimum detectable change is set to 1 * Sigma, in this case, 10.9792.
The note beneath the chart explains the size of a shift the chart can detect, nearly 11 (Deg. C). You can see no detectable shift is visible on this chart.
In our case, we wanted to detect a 10 (Deg. C) shift, and our ideal operating temperature is 100, rather than 103. First, we can change the Target value to 100. You’ll see the chart automatically updates to reflect the change in the cumulative deviation sums. In the figure below, I also changed the Sigma value to 10, to reflect the original engine design specifications.
 Figure 3. CUSUM Control Chart of temperature with Target set to 100
Here, we see the process has clearly shifted upwards, starting around the 27th sample, where the purple line indicating the beginning of the shift lies.
A new generation of small-shift detection
CUSUM charts are designed to spot when the process has drifted away from the desired mean. CUSUM charts are, in fact, better than Shewhart control charts when you need to detect shifts in the mean that are 2 sigma or less.
The new CUSUM Control Chart platform in JMP is a new generation of small-shift detection, improving shift identification sensitivity, and making the CUSUM chart more approachable and intuitive compared to older methods.