JMPer Cable
A technical blog for JMP users of all levels, full of how-to's, tips and tricks, and detailed information on JMP features- JMP User Community
- :
- Blogs
- :
- JMPer Cable
- :
- Creating a phase control chart with specification limits via JSL
- Subscribe to RSS Feed
- Mark as New
- Mark as Read
- Bookmark
- Subscribe
- Printer Friendly Page
- Report Inappropriate Content
You may have read the blog post titled “Process specification limits that differ based on a grouping column” and thought

Maybe you were really looking for a single phase control chart with the specification limits plotted on the graph....
One of the great features in JMP is its flexible scripting language. Through the use of JMP Scripting Language (JSL), you can create the type of graph you are looking for. This blog post details the script needed to produce that single phase control chart with the specification limits plotted on the graph.
Example: Printing text in books
In my blog post "Process specification limits that differ based on a grouping column", I introduced an example from a printing process. Let’s review that example. Variations in the printing process can cause distortion in the line, including skew, thickness and length problems. For this example, we are going to consider the length of the line. If the line is too long, the sentence may run off of the page. If the line is too short, there will be a lot of wasted space on the page.
For this particular data, we have two different book sizes. The hardcover books are 17.78 cm wide. The paperback books are 13.97 cm wide. The line length in a hardcover book is considered good if it has a printed length of 16 cm +/- 0.2 cm. The line length in a paperback book is considered good if it has a printed length of 12 +/- 0.4 cm. In every print run, the first and last books are taken for measurement. The line lengths are measured on a specified page in the middle of each book.
Analysis
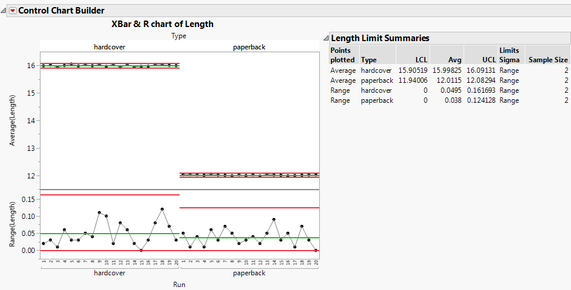
To create a phase control chart for this example, select Control Chart Builder from the Quality and Process menu. Drag Length to Y. Drag Type to Phase. Drag Run to the x axis.
We learned from the blog post titled “Process specification limits that differ based on a grouping column” that we can’t use the spec limit column property or the Spec Limits command because these commands apply to the entire Column (in this case Length). This means that both phases would have the same spec limits which is not what we want. Therefore, we must add these via scripting.
Getting the control chart script
To obtain the script that produces this graph, select “Save Script to Script Window” from the red triangle next to Control Chart Builder. You are provided with the following script.
Control Chart Builder(
	Show Capability( 0 ),
	Variables( Subgroup( :Run ), Y( :Length ), Phase( :Type ) ),
	Chart( Position( 1 ) ),
	Chart( Position( 2 ) ),
	SendToReport(
		Dispatch(
			{},
			"Control Chart Builder",
			FrameBox,
			{DispatchSeg(
				TextSeg( 3 ),
				{Line Color( "None" ), Fill Color( "None" )}
			), DispatchSeg(
				TextSeg( 4 ),
				{Line Color( "None" ), Fill Color( "None" )}
			)}
		)
	)
);
To make the script more robust and easier to use for our purposes, we will add a few things to this script. We add code before the script to open the necessary data tables (the actual data and the spec limits table which we will talk about later), assign the script a handle, point the script to the data table of interest, and add a handle to the report.
dt=Open("SpecChange.jmp");     //actual data
dtSpec=Open("specChangelimits.jmp");  //data containing specification limits
obj=dt<<Control Chart Builder(
	Show Capability( 0 ),
	Variables( Subgroup( :Run ), Y( :Length ), Phase( :Type ) ),
	Chart( Position( 1 ) ),
	Chart( Position( 2 ) ),
	SendToReport(
		Dispatch(
			{},
			"Control Chart Builder",
			FrameBox,
			{DispatchSeg(
				TextSeg( 3 ),
				{Line Color( "None" ), Fill Color( "None" )}
			), DispatchSeg(
				TextSeg( 4 ),
				{Line Color( "None" ), Fill Color( "None" )}
			)}
		)
	)
);
rpt=obj<<report;
Next, we must figure out how to add the specification limits to this existing script.
H Line Command
By default in JMP, spec limit lines are added as reference lines. You may consider adding reference lines via JSL. If you try this, you will discover that this does not give you want you want either. As with the previously mentioned methods, reference lines apply to the entire graph and would therefore be present across both phases (hardcover and paperback). Instead, we can accomplish separate spec lines for each phase by way of a line segment. The particular line segment we want to use is H Line. The H Line command has the following form:
H Line( x1, x2, y);
It draws a horizontal line at y from x1 to x2 through the entire frame.
Determine the values for x1 and x2
We can take advantage of the information that JMP already knows. The control chart already knows what x1 and x2 are for both hardcover and paperback because it has already drawn control limit lines on the graph. We can use those existing Line Segs to determine x1 and x2.
actLineSeg=(rpt[FrameBox(2)]<<xpath("//LineSeg"));   //get the Line Segs for the location chart
actDescriptions=actLineSeg<<get Description;  //get the descriptions for the line segs
actx=actPhase={};     //create an empty list to hold values
for(i=1, i<=narg(actLineSeg), i++,   //for each line seg
   if(Contains(arg(actDescriptions,i), "Average")>0,   //if the description contains the word average
 	   actx=Insert(actx , arg(actLineSeg,i)<<get x values);  //store the x values in actx
	   actPhase=Insert(actPhase, Word(2, arg(actDescriptions,i), " ()"));  //store the phase in actPhase
   );
);
In the code above, we first find the line segs for the location chart. Next, we obtain the descriptions for each line seg. We create two lists actx and actPhase. When the description contains the word "Average", the x values from the line seg are stored in actx and the phase label is stored in actPhase.
Obtaining the y argument for H Line
The method that you use to get y will be determined by how you have stored this information. For the purposes of this example and blog post, we will make the assumption that this information is stored in a separate data table just as it was in the blog post “Process specification limits that differ based on a grouping column.”
We will need to match up the value of actPhase (obtained with the previous script) with the column “Type” in our specification limits data table. Your phase variable will not always be called “Type.” To make the JSL more generic so that it can be used in other examples, we can obtain the name of the phase variable from the control chart builder report. Specifically, we can pull this information from the phase labels that appear directly above the graph.
actPhaseName=(rpt[GraphBuilderBox(1)]<<xpath("//TextBox"))[1]<<get text;
//obtain the name of the phase column
After the appropriate row in the spec limits table has been determined, we can obtain the values of the lower specification limit, the target, and the upper specification limit from the columns LSL, Target, and USL in the spec limits data table.
for(j=1, j<=narg(actx),j++,  //for every argument of actx
   for(k=1, k<=nrows(dtSpec), k++,   //for every row of the specification data table
      if(arg(actPhase,j)==Column(dtSpec, actPhaseName)[k],
      //if actPhase is equal to Type in the specification table
         H Line( arg(actx,j)[1], arg(actx,j)[2], Column(dtSpec, "LSL")[k] );
         H Line( arg(actx,j)[1], arg(actx,j)[2], Column(dtSpec, "Target")[k]);
         H Line( arg(actx,j)[1], arg(actx,j)[2], Column(dtSpec, "USL")[k] );
      );
   );
);
Graphic Script
How do we use the H Lines in our script? The HLine commands need to be wrapped in a graphics script command. Graphics scripts are how we add graphical items to an existing frame within a report window. We will add a description to the script as well as pick the pen color for the specification limit lines. We can also determine the grid line order and reference line order if necessary. The graphics script can be sent to the control chart builder window via the SendTo Report command.
obj<<SendToReport(
   Dispatch({},
      "Control Chart Builder",  //send to the control chart builder report
      FrameBox( 2 ),    //the location chart
      {Add Graphics Script(
         2,
         Description( "Spec Limits" ),
         Pen Color( "blue" );
         for(j=1, j<=narg(actx),j++,  //for every argument of actx
            for(k=1, k<=nrows(dtSpec), k++,   //for every row of the specification data table
               if(arg(actPhase,j)==Column(dtSpec, actPhaseName)[k],
               //if actPhase is equal to Type in the specification table
                  H Line( arg(actx,j)[1], arg(actx,j)[2], Column(dtSpec, "LSL")[k] );
                  H Line( arg(actx,j)[1], arg(actx,j)[2], Column(dtSpec, "Target")[k]);
                  H Line( arg(actx,j)[1], arg(actx,j)[2], Column(dtSpec, "USL")[k] );
               );
            );
         );
      ), Grid Line Order( 1 ), Reference Line Order( 3 )}
   )
);
Conclusion
Putting all of these pieces together we have the following finished script:
dt=Open("SpecChange.jmp");     //actual data
dtSpec=Open("specChangelimits.jmp");  //data containing specification limits
obj=dt<<Control Chart Builder(
   Show Capability( 0 ),
   Variables( Subgroup( :Run ), Y( :Length ), Phase( :Type ) ),
   Chart( Position( 1 ) ),
   Chart( Position( 2 ) ),
   SendToReport(
      Dispatch(
         {},
         "Control Chart Builder",
         FrameBox,
         {DispatchSeg(
            TextSeg( 3 ),
			{Line Color( "None" ), Fill Color( "None" )}
         ),
         DispatchSeg(
			TextSeg( 4 ),
			{Line Color( "None" ), Fill Color( "None" )}
         )}
      )
   )
);
rpt=obj<<report;

actLineSeg=(rpt[FrameBox(2)]<<xpath("//LineSeg"));   //get the Line Segs for the location chart
actDescriptions=actLineSeg<<get Description;  //get the descriptions for the line segs
actx=actPhase={};     //create an empty list to hold values
for(i=1, i<=narg(actLineSeg), i++,   //for each line seg
   if(Contains(arg(actDescriptions,i), "Average")>0,   //if the description contains the word average
      actx=Insert(actx , arg(actLineSeg,i)<<get x values);  //store the x values in actx
      actPhase=Insert(actPhase, Word(2, arg(actDescriptions,i), " ()"));  //store the phase in actPhase
   );
);

actPhaseName=(rpt[GraphBuilderBox(1)]<<xpath("//TextBox"))[1]<<get text;
//obtain the name of the phase column

obj<<SendToReport(
   Dispatch({},
      "Control Chart Builder",  //send to the control chart builder report
      FrameBox( 2 ),    //the location chart
      {Add Graphics Script(
         2,
         Description( "Spec Limits" ),
         Pen Color( "blue" );
         for(j=1, j<=narg(actx),j++,  //for every argument of actx
            for(k=1, k<=nrows(dtSpec), k++,   //for every row of the specification data table
               if(arg(actPhase,j)==Column(dtSpec, actPhaseName)[k],
               //if actPhase is equal to Type in the specification table
			      H Line( arg(actx,j)[1], arg(actx,j)[2], Column(dtSpec, "LSL")[k] );
			      H Line( arg(actx,j)[1], arg(actx,j)[2], Column(dtSpec, "Target")[k]);
			      H Line( arg(actx,j)[1], arg(actx,j)[2], Column(dtSpec, "USL")[k] );
			   );
            );
         );
      ), Grid Line Order( 1 ), Reference Line Order( 3 )}
   )
);
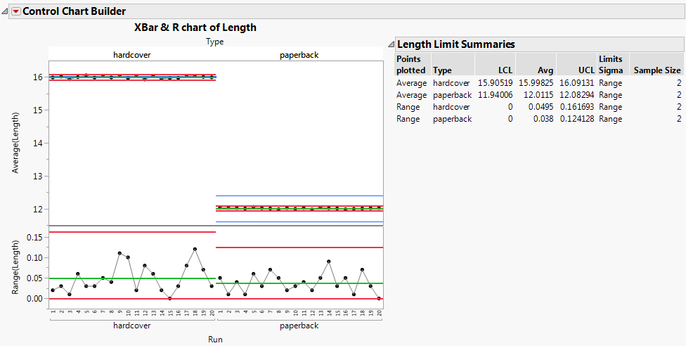
Running this script yields the following results.

You can see from the above image that one set of specification limits appears for hardcover (15.98, 16, 16.02) and a different set of specification limits appears for paperback (11.6, 12, 12.4).
This script is generic in the sense that you can have as many phase levels as you desire, the levels can be named anything you want, and the phase column can be named anything you want. However, the script does require that your specification limits be stored in a separate data table. The specification limits data table requires that there is 1 row per phase level. The phase level names must match the level names shown in the CCB report. The data table must contain columns titled LSL, Target, and USL that store the lower specification limit, the target, and the upper specification limit respectively.
- © 2026 JMP Statistical Discovery LLC. All Rights Reserved.
- Terms of Use
- Privacy Statement
- Contact Us


You must be a registered user to add a comment. If you've already registered, sign in. Otherwise, register and sign in.