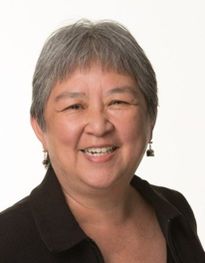
 Dr. Patricia Chow-FraserDr. Patricia Chow-Fraser is a Professor of Biology at McMaster University in Ontario, Canada, where she studies the ecology, conservation and restoration of aquatic ecosystems. Her fieldwork – conducted primarily in the coastal zones of the Laurentian Great Lake region – seeks to monitor and predict the long-term impact of human activities on ecosystem health. In addition to physical sampling, Chow-Fraser’s lab also makes use of satellite data to track environmental change, wetland connectivity and habitat loss.
A JMP user for more than 30 years, Chow-Fraser spoke with me about her research.
Let’s start by talking about some of the central questions motivating your research.
PCF: We develop and use ecological indicators to assess the impact of human activities, such as urban, agricultural and recreational development and climate change, on the long-term health of wetlands and streams in the Great Lakes basin. The ecological indicators are based on biotic communities, including wetland plants, zooplankton, fish, amphibians and turtles, as well as abiotic variables such as water quality, hydrogeomorphy and habitat integrity.
What, in your opinion, is the most common misconception you encounter in ecology today?
PCF: A common misconception is that wetlands are wastelands and that they need to be drained to be transformed into useful land. Another I have encountered is that wetlands can be created and/or restored back to their original health and functionality. Most wetlands cannot be restored – the best we can do is rehabilitate them.
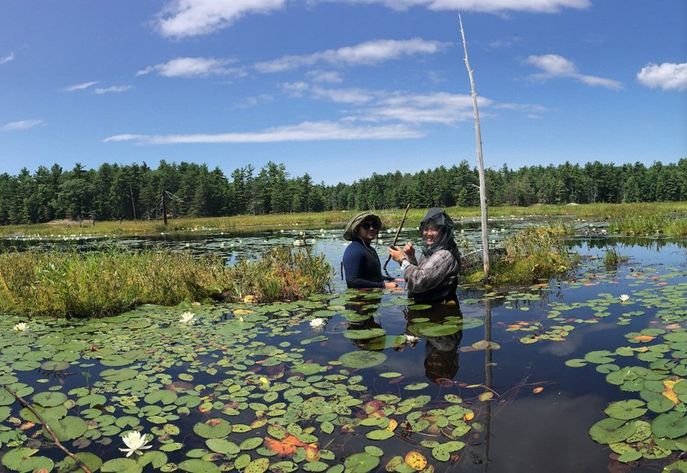 Students set a hoop net to catch turtles in a wetland.
Tell me about your research methods. What kinds of data do you collect?
PCF: We collect many types of physico-chemical data – temperature, dissolved oxygen or conductivity, for example – with vertical profiling sondes, as well as samples of nutrient data from wetlands, lakes and streams, typically spanning multiple years or decades. We also have biotic datasets on abundances and richness of fish, benthic invertebrates, birds, amphibians, as well as percent cover of macrophyte and terrestrial vegetation.
For use in geographic information systems, we collect radio telemetry data of fish and turtles to determine their movements, home ranges and habitat uses. We often tap archived public long-term data sets to use in various research projects. Students empty fyke nets into a tub.
What are some of the biggest data challenges you encounter in doing this kind of work?
PCF: Typically, the environmental data sets are large and messy. The format of publicly archived data sets requires pre-processing and manipulations to render them usable. The data do not tend to meet the assumptions of parametric tests and must therefore be transformed before we can use parametric tests, or often, we use non-parametric tests instead. Producing publishable graphs for these large data sets is also a challenge.
What’s a typical data workflow like?
PCF: Often our first step involves joining biotic and abiotic data sets by station ID and date. Most data start off in Excel and the date fields are entered in various formats. We have to standardize the date format and ensure the site name is identical in all data sets before we join them. We sometimes have to split the test values by the tests before we can conduct multivariate analyses. Such pre-processing and manipulations are sometimes performed on data sets with millions of rows and dozens of columns.
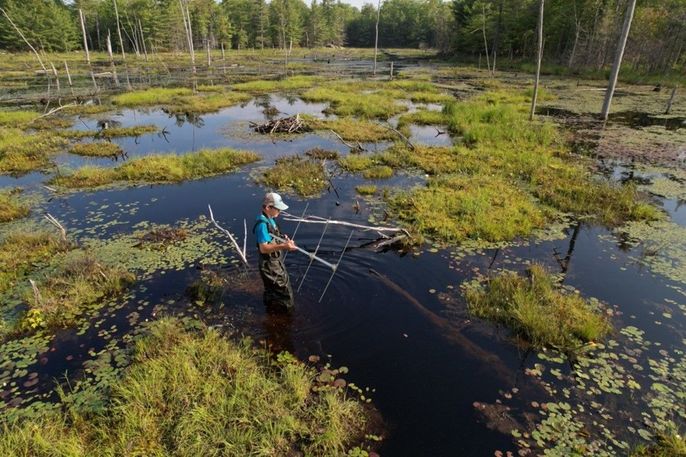 A student uses an antenna to track the location of turtles with transmitters.
Can you share an example of a time in which a particular statistical approach led you to a key discovery or result?
PCF: In the late 1990s, we were developing ecological indicators to determine the effectiveness of a marsh restoration project in Cootes Paradise Marsh in Hamilton, Ontario. At the same time, I was also quantifying long-term changes in water quality and biotic communities in Cootes Paradise. I used a principal components analysis to show that the suite of water-quality parameters changed predictably as Cootes Paradise underwent degradation over five decades.
In a similar way, the species of zooplankton also changed predictably through time according to published tolerance of degraded water quality. My PhD student used both data sets in a canonical correspondence analysis to develop the Wetland Zooplankton Index, which was subsequently used to track the effectiveness of the marsh restoration. Using the same approach, our lab later developed the Wetland Macrophyte Index and the Wetland Fish Index that we have since used to assess the health status of hundreds of wetlands throughout the Great Lakes basin.
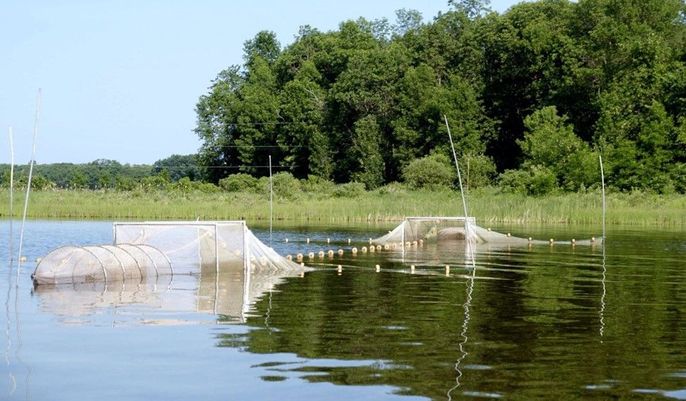 Paired fyke nets are left overnight to catch fish that swim from open water into the nets.
When did you realize that statistics would be an important part of your research? How did you learn statistics?
PCF: I was fortunate to have known a great ecology professor from the University of Waterloo who revealed the value of statistics to his students. He infused stats throughout the three courses I took with him, and I learned most of what I know not from traditional statistics courses, but from these ecology courses. I have tried to pay this forward in my own teaching at McMaster.
What advice would you give to the next generation of biology students and grad students?
PCF: Statistics is a universal language of research. If students do not have access to personal translators, then they must learn to speak this language themselves to make the most of research. Fluency in stats requires students to practice it as frequently as possible, and to be willing to share what they know with others – even if this means they make mistakes sometimes. Like any language, some words are more important than others, and students should get to know those words first.
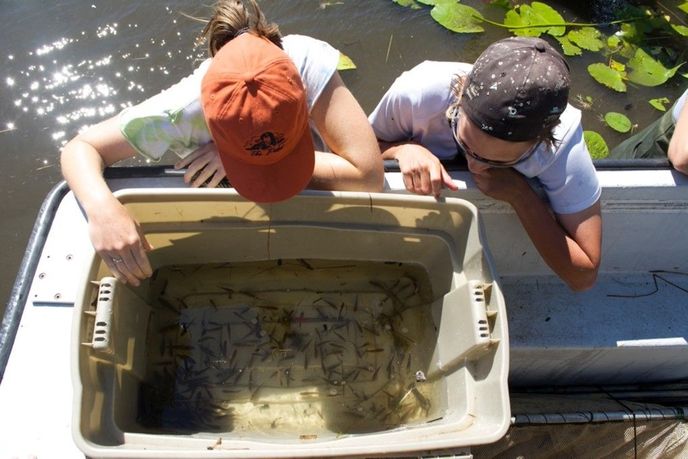 Fish caught in fyke or seine nets are placed in a tub before they are processed.
Find more resources for teaching and learning statistics by checking out the JMP Academic Program.
You must be a registered user to add a comment. If you've already registered, sign in. Otherwise, register and sign in.