Analyzing survey responses from virtual hands-on workshop
We thought we’d share what we learned, to show you how we do our analysis in JMP.

Weeks one and two of my efforts to unlock running efficiency through design of experiments (DOE) are complete. Here, I unpack the controlled and uncontrolled variables, casually discuss the weather, and share preliminary results.
Week one of my effort to unlock running efficiency through design of experiments (DOE) is in the books.
Using JMP to decide whether to sign up for a snow removal service brings up a graphing question.
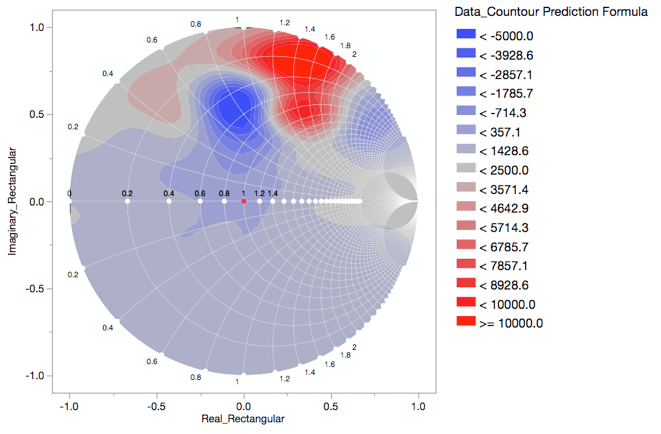
It started with a "quick" question about how to make a Smith Chart.
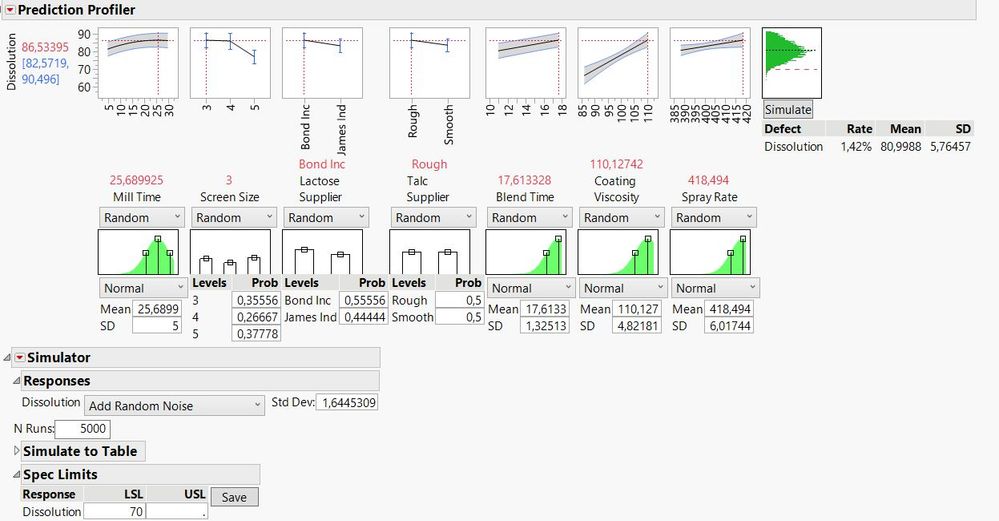
DoE is an efficient strategy for exploring the possibility space.
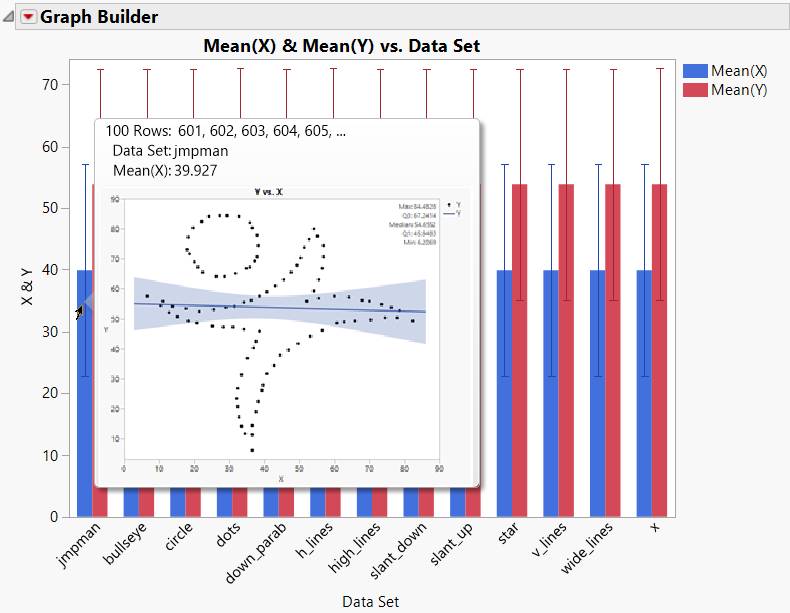
What if you could save time by getting to details immediately with compelling graphs? You can effortlessly drill down into your data to provide deeper details and get to the point faster with the JMP visual workflow.
No passports, no visas, no airline tickets needed.
Alfredo Lopez Navarro, Telefónica, on the benefits of empowering everyone in your organization to use statistics to make decisions.
Julia O’Neill, Direxa Consulting, describes an ‘aha!’ moment when she led a team of scientists who collaborated with data and built consensus with analytics.
On 31 March we hosted our first JMP Virtual Hands-on Workshop in Europe. Screenshot of "Distributions" platform, from the "Introduction to JMP" part of the workshop.
Bradley Jones of SAS shares one of his favorite examples of the value of design of experiments.
Patti McNeill of Lundbeck talks about the project that convinced her to adopt modern, structured experimentation.
Melisa Buie of Coherent talks about a 15-year-old problem that cost her company millions of dollars and how design of experiments quickly led to a solution.
Professor Bernadette Lanciaux excites her students to learn the fundamentals of statistics in the digital age. We asked her to share how she does this in our latest issue of JMP Foreword.
I explored my exercise activity data to find out where R&D happens in the UK and Ireland and found out the importance of good tools for data access, preparation, exploration and analysis.
Sir David Spiegelhalter says, “You can do an amazing amount just by looking at the data.” The best ways to communicate risks are by sharing absolute risks and expected frequencies with carefully chosen graphics.
Discovery Online plenary features new tools in JMP 15, including time series forecasting. John Sall presents key JMP 15 features at first Discovery Online plenary.
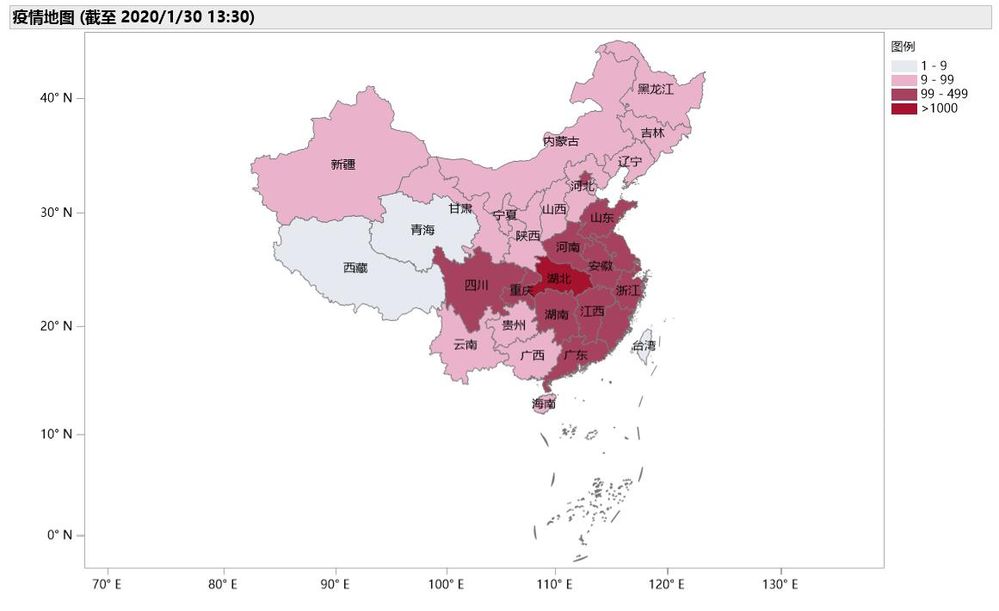
Based on some basic retrospective data of the China epidemic in early February, let's briefly explain the basic process of publishing reports through JMP Live .
Ritalv